The asphyxiated term infant
Mary A Rutherford
Chapter Contents
- Hypoxic–ischemic encephalopathy
- Imaging techniques
- MRI pulse sequences
- Patterns of injury
- Early MRI findings
- Pattern recognition, scoring systems and prediction of outcome in term infants with HIE
- The preterm asphyxiated brain
- Case histories
- Summary
- References
Hypoxic–ischemic encephalopathy
Infants who have been asphyxiated during delivery may develop signs of hypoxic–ischemic encephalopathy (HIE). This term is used to describe mature neonates (gestation >37 weeks) who show signs of fetal distress prior to delivery, who have abnormal Apgar scores and require resuscitation at birth and who show specific neurological abnormalities during the first 24h after delivery. Signs of fetal distress include abnormal cardiotocograph recordings such as decreased variability, late decelerations (type II dips), and a baseline bradycardia <100/min with or without meconium-stained liquor. A fetal scalp pH of less than 7.2 is also indicative of fetal hypoxia, although values of <7.0 are usually found. Abnormal neurological signs in HIE include feeding difficulties, irritability, abnormalities of tone, convulsions and a decreased conscious level. The severity of HIE may be graded as stage I, II or III according to Sarnat and Sarnat38. Classification is difficult in ventilated infants and those receiving anticonvulsant medication. Even when all the criteria for HIE are fulfilled it may still be difficult to attribute an infant’s clinical signs as solely due to hypoxia/ischemia. A pre-existing neurological condition may predispose an infant to an abnormal delivery and/or a hypoxic–ischaemic insult and a screen for infection, metabolic disorders and congenital malformations is always warranted. Although preterm infants are at high risk of asphyxia, the HIE staging should be reserved for term infants. Despite improvements in perinatal care in the developed world, asphyxia remains a major cause of mortality, resulting in up to 25% of perinatal mortality and morbidity and giving rise to between 8 and 15% of all cases of cerebral palsy.
< prev | top | contents | next >
Imaging
Infants with signs of HIE may be scanned with three different techniques during the neonatal period: cranial ultrasound, computerized tomography (CT) and magnetic resonance imaging (MRI). Cranial ultrasound has the advantage of being mobile and easily used on the neonatal unit. It is ideal for doing daily or twice daily scans to follow the evolution of changes within the brain. As with all techniques, expertise is needed not only to obtain the correct scan views but more importantly to interpret the results correctly. This is most easily done at the time of scanning, although video replay provides a suitable method of retrospective review. It is exceedingly difficult to interpret paper reprints, particularly when they have been taken by a different operator. Cranial ultrasound is valuable for identifying cerebral edema and parenchymal or intraventricular hemorrhage. Areas of parenchymal infarction may take several days to be visualized as an echo density. Using a 5MHz transducer to increase penetration, echo densities within the basal ganglia are easily visualized and are predictive of outcome 17, 23 although they may take several days to become apparent. Using a 10Mhz transducer allows identification of areas of cortical highlighting and subcortical white matter infarction16. Cranial ultrasound is very good at identifying cystic lesions within the parenchyma. Using the posterior fontanelle improves the ability of cranial ultrasound to detect lesions following HIE14. Cranial ultrasound will always provide a method for screening and monitoring the evolution of lesions but is not as good as MRI at determining the exact site, and extent of lesions. The combination of cranial ultrasound and MRI is ideal for assessing the newborn brain.
CT has the advantage that it is available in many hospitals and is relatively cheap. However, machines, as with MRI, are usually at a distance from the neonatal unit and CT scanning involves exposure to a significant amount of radiation. It is not therefore suitable for serial scanning. CT is good for identifying acute hemorrhage and this has been the one advantage over MRI. However, the ability of the MR to detect acute hemorrhage has improved with gradient echo sequences and it is now less justifiable to use CT to image neurologically abnormal infants. CT has been used to study infants with HIE1 but there are very few recent studies. Decreased attenuation in the white matter during the second week from delivery has been associated with an abnormal outcome. A more recent study documented the presence of cortical abnormalities consistent with highlighting on MRI (see below) in infants with HIE12. In our experience CT is often unable to detect significant basal ganglia and thalamic lesions.
MRI is a relatively new technique but is becoming more widely available. In addition, a few MR suites are now being installed either within or adjacent to neonatal units. MR provides superb definition of the brain compared to both ultrasound and CT. It does not involve the use of radiation and is therefore suitable for serial scanning. It is multiplanar, which results in improved detection of lesions and better estimation of their exact site and size. MR data are readily quantifiable. A combination of ultrasound and MRI is ideal for assessing the neurologically abnormal neonate. Careful comparative studies between these techniques, ideally with additional histology, should result in MRI improving the abilities of cranial ultrasound to detect lesions rather than replacing it as an imaging technique.
< prev | top | contents | next >
MRI pulse sequences
Commercial scanners contain sequences that are appropriate for studying the adult brain but some sequences will need to be adapted for neonatal brain imaging (see Chapters 1 and 2). The choice of sequences used for an examination is limited by their availability and the duration of the scan. Infants may be clinically unstable, or sedation may wear off. For neonatal imaging we routinely used a T1 weighted spin echo (SE 860/20), a conventional T2 weighted spin echo (SE 2700/120) and an inversion recovery (IR 3800/30/950) sequence. In addition, we now perform a T2 weighted fast spin echo (SE 3000/208) sequence. Diffusion weighted imaging has been time consuming in the past but fast imaging has made this a practical addition to MRI examinations. Image resolution using fast diffusion weighted images may not be sufficient to produce adequate anatomical detail for mapping of white matter tracts but it is useful for the early identification of white matter infarction. There is little information about the role of contrast enhancement in infants with HIE. The appearances of the normal neonatal brain following contrast have been described8 (see Chapter 4). Contrast may ‘enhance’ cortical abnormalities in HIE but there may also be confusion with the presence of contrast within cortical veins and in our experience the abnormality was always detectable prior to contrast administration. The use of contrast enhancement is essential if infection is suspected and as the diagnosis of HIE is not always clear cut there is an argument for using contrast routinely. Fluid attenuated inversion recovery (FLAIR) sequences have proved useful for the identification of both subarachnoid and intraventricular hemorrhage in adult patients but have not been systematically studied in the neonate26. The FLAIR sequence is useful after the first year of life for identifying abnormally increased T2 consistent with glial tissue (Fig. 6.11, cases 6.4 and 6.7). Proton density images may be useful in the first few days after delivery as abnormalities within the basal ganglia and thalami appear early6. This sequence may also provide early information on ‘cortical edema’6 or loss of gray/white matter differentiation. To date we have not found it more useful than early T1 and T2 weighted images. Adult fast imaging has shown the role of diffusion/perfusion sequences for identifying early ischemia. The role of perfusion weighted imaging in the neonate has yet to be established.
< prev | top | contents | next >
Patterns of injury
MRI has been widely used to investigate the asphyxiated infant2, 3, 6, 9, 19, 34–36 . The abnormalities identified on imaging will vary according to the magnet and sequences used and the postnatal age of the infant at the time of the scan. The pattern of injury seen on MRI is related to the type and severity of the insult. Severe acute asphyxia is associated with lesions in the basal ganglia, thalami, brain stem, hippocampus and the corticospinal tracts around the central fissure3, 23, 27, 28, 30, 31, . This has been termed central cortico–subcortical involvement. This is the most common pattern of injury following acute fetal distress during labor and delivery.
Infants with a chronic, possibly repetitive insult are more likely to show abnormalities within the cortex and white matter. This may have a classical parasagittal distribution, involving the territory between major arteries41. Infants with white matter lesions may fulfill all the criteria for HIE but often the clinical condition of the infant and the amount of damage seen on imaging appear to be out of keeping with the documented perinatal fetal distress. Repeated antenatal insults in these infants are thought to prime the white matter by diverting blood to metabolically more active parts of the developing brain such as the basal ganglia and thalami. A comparatively small perinatal insult may therefore result in extensive damage to the white matter and cortex (cases case 6.6 and case 6.7). Some infants may sustain severe white matter and severe basal ganglia and thalamic injury. This may result from a more severe perinatal insult occurring in combination with a chronic or repetitive insult that primes the white matter (case 6.8).
Major white matter infarction may also be seen in infants who have other predisposing factors such as hypoglycemia7, 20, 25, 39, 42 . Some of these infants may also show other systemic abnormalities, for example conjugated hyperbilirubinemia, suggestive of an underlying metabolic disorder. Infants with primarily white matter damage may have a hemorrhagic component to their lesions (see Chapter 9). We have found an incidence of large parenchymal hemorrhagic lesions in infants with apparent HIE of approximately 5%. The outcome in these atypical infants may depend on any underlying pathology, for example a metabolic or thrombotic disorder, which should be sought. Caution needs to be exercised in predicting outcome from imaging alone. In our experience these infants develop mild motor signs but may have a significant cognitive deficit.
During the first week after delivery there are six main areas of abnormality that may be identified on MRI in infants who fulfill all the criteria for HIE. Whilst one particular pattern may predominate, in most infants there are a combination of abnormalities. The early MRI findings are listed in Table 6.1.
Table 6.1 Early findings that may be identified during the first week after birth
| Brain swelling |
| Loss of the normal signal in the posterior limb of the internal capsule |
| Abnormal signal intensities in the basal ganglia and thalami |
| Brain stem lesions |
| Loss of gray/white matter differentiation |
| Cortical highlighting (T1 weighted sequences) |
< prev | top | contents | next >
Early MRI findings
BRAIN SWELLING
Abnormalities consistent with swelling of the brain may appear during the first 24–48h following an asphyxial episode, mirroring the changes identified on ultrasound. These signs are best identified on T1 weighted spin echo sequences. Five signs of brain swelling may be demonstrated: (1) loss of extracerebral space; (2) loss of sulcal markings; (3) closure of the Sylvian fissures; (4) narrow interhemispheric fissure; and (5) slit-like anterior horns of the lateral ventricles (Fig. 6.1). There may be loss of the normal anatomical detail. Infants with severely swollen brains will have all signs. More severe swelling may be associated with white matter and cortical lesions. Mild degrees of brain swelling may be seen in infants who have not had documented asphyxia and infants with severe acute insults may have no obvious swelling.


Fig. 6.1 Brain swelling. T1 weighted spin echo sequence (SE 860/20) of two different term-born infants aged 2 days. (a) Normal brain with no obvious swelling. The ventricles of a normal term-born infant are usually narrow. (b) Severe brain swelling showing slit-like ventricles, complete ‘closure’ of the interhemispheric fissure and no visible extracerebral space or sulci.
Evolution
Brain swelling, even if initially severe, is usually no longer evident by the second week.34
Pathology
Swelling is likely to represent brain edema, but it is not easy to differentiate between vasogenic or cytotoxic edema on conventional scans alone. Brain swelling on T1 weighted images may be associated with some loss of gray/white matter differentiation; if this is severe and also present on the inversion recovery and T2 weighted images then it is likely to be cytotoxic edema. Diffusion weighted imaging during the first week after delivery will also identify areas of cytotoxic edema with impending tissue breakdown. On diffusion weighted images areas of infarction are seen as abnormal high signal intensity consistent with restricted diffusion of water.
Clinical outcome
The presence of brain swelling makes assessment of the brain more difficult. However, if the underlying brain is normal in appearance at the end of the first week once the swelling has disappeared, the clinical outlook is good, although follow-up scans may show patchy increased T2 in the periventricular white matter (case 6.1). These periventricular changes may just represent immature unmyelinated white matter, so-called terminal zones, but are usually more marked than in normal children and are not always confined to the posterior periventricular white matter. We are currently looking at the neurodevelopmental outcome at school age in infants with stage I and II HIE who were developmentally normal at 2 years of age in order to identify more subtle minor motor difficulties or cognitive impairments.
THE POSTERIOR LIMB OF THE INTERNAL CAPSULE
The normal term infant will have evidence of myelination in approximately one-third to one-half of the posterior limb of the internal capsule (PLIC) on a T1 weighted sequence. Some myelin within the posterior limb should be visible from 37 weeks’ gestation or slightly earlier in ex-preterm infants. This can be seen as high signal intensity on T1 weighted spin echo or inversion recovery sequences and low signal intensity on T2 weighted spin echo sequences (Fig. 6.2). The inversion recovery sequence is the best for demonstrating myelination within the internal capsule in the neonatal period. Using a fast spin echo T2 weighted image myelin may be clearly seen as low signal intensity within a higher signal intensity posterior limb but the low signal intensity seen on conventional T2 weighted imaging may be more subtle. The normal appearances of the posterior limb of the internal capsule using diffusion weighted imaging are also shown in Figure 4.7.


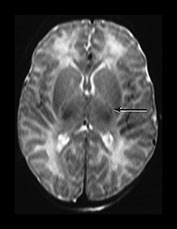
Fig. 6.2 Normal appearances of the posterior limb of the internal capsule. (a) T1 weighted spin echo sequence (SE 860/20). (b) Inversion recovery sequence (IR 3800/30/950). (c) T2 weighted spin echo sequence (SE 2700/120). Myelination within the posterior limb of the internal capsule is marked with an arrow. The most obvious signal from myelin is seen in the inversion recovery image (b). The low signal from myelin on the T2 weighted image (c) is the least obvious.
Loss of the normal signal intensity within the posterior limb of the internal capsule
A complete loss or a change in the normal signal intensity from myelin may be seen following perinatal asphyxia. This may may take 1–2 days to evolve and there may therefore be apparently normal signal intensity from myelin on the first scan if done very early (Fig. 6.3). The signal intensity from myelin may be diminished or asymmetrical, ‘equivocal’, prior to its loss. In association with the loss of normal signal intensity from within the limb there may be abnormal signal intensities running parallel to the posterior limb in the lentiform nucleus. These should not be confused with the normal signal from myelin (Fig. 6.18, Case 6.3) There may also be abnormal low signal intensity on T1 weighted images or abnormally high signal intensity on T2 weighted images in the unmyelinated more anterior portion of the internal capsule (Fig. 6.3). Occasionally the internal capsule may look grossly abnormal on T1 weighted imaging but surprisingly normal on T2 weighted images. A combination of sequences is always recommended. This sign will always be easier to detect towards the end of the first week and in the presence of abnormal signal intensity either side of the posterior limb in the lentiform nucleus and thalami.
Evolution
The normal signal intensity from myelin may return after some weeks or months, although it is often irregular in outline. The rate of return depends on the severity of injury to the basal ganglia and thalami. In the presence of gross atrophy of the basal ganglia and thalami the tracts appear to be irreversibly damaged and if and when myelination appears it is very irregular and discontinuous (Fig. 6.3).
Pathology
The increased T1 within the PLIC is consistent with edema or infarction. The finding of an increased signal on diffusion weighted imaging in all three planes of sensitization (Fig. 6.4) is indicative of cytotoxic edema with loss of anisotropy. Infants who have had abnormal signal intensity within the posterior limb and who have died in the acute stages of HIE show histological signs of edema in this region (Fig. 6.4)18.
Outcome
The loss of a signal intensity within a structure is easier to detect than an exaggeration which is highly dependent on the sequence and the windowing used to obtain the image.
In our experience all term infants with HIE who show abnormal signal intensity within the PLIC have an abnormal neurodevelopmental outcome (sensitivity 0.91, specificity 1.0, positive predictive value 1.0) (cases 6.3–6.7)36. It is important to have a correct estimate of gestation as the absence of myelin on MRI is a normal finding below 37 weeks’ gestation. In addition, infants with a primary metabolic disorder may have delayed myelination which would include an absence of myelin within the posterior limb at term (see Chapter 17). Certain metabolic disorders, for example non-ketotic hyperglycemia, which present in the neonatal period may mimic HIE and a metabolic screen in any asphyxiated infant is always warranted.


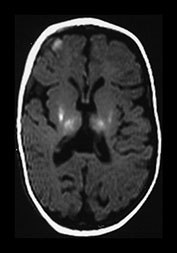
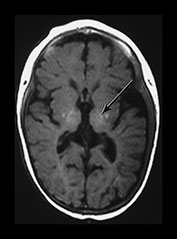
Fig. 6.3 Abnormal signal intensity within the posterior limb of the internal capsule. Inversion recovery sequence (IR 3800/30/950). (a) Complete loss of the normal SI at 1 day of age in an infant with stage III HIE who died. (b) Partial loss of the normal signal intensity at 4 days of age in an infant with HIE II who developed a mild quadriplegia. The signal intensity on the left is diminished (arrow). (c) Delayed loss of signal intensity (i) image obtained at 2 days, showing a normal high signal intensity within the posterior limb, and (ii) image at 4 days (with contrast) in an infant with stage III HIE who subsequently died. (d) T1 weighted spin echo sequence (SE 860/20) (i) and T2 weighted fast spin echo sequence (FSE 3000/208) (ii). Absent signal intensity in an infant with stage II HIE at 15 days of age. The T2 weighted images show the posterior limb of the internal capsule as a broad band of high signal intensity (arrow). There is no normal low signal intensity within this, consistent with the presence of normal myelin. There are obvious abnormal signal intensities in the thalamus and lentiform nucleus either side of the abnormal internal capsule. (iii) The same infant at 2 months of age. The signal intensity within the internal capsule is still absent. The abnormal signal intensities within the thalamus and lentiform nucleus are still present. (iv) The same infant at 5 months of age. There is some signal intensity within the internal caspule. This is thin and not appropriate for 5 months. The abnormal signal intensities within the thalamus and internal capsule are much less obvious.


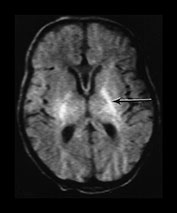


Fig. 6.4 Abnormal signal intensity within the posterior limb of the internal capsule: histological findings. Male infant with stage III HIE who subsequently died, imaged at 12 days. (a) Inversion recovery sequence (IR 3800/30/950). The internal capsule is seen as a broad band of low signal intensity with a very thin slightly increased signal intensity within it (arrow). There is abnormal high signal intensity within the posterior part of the lentiform nuclei and within the lateral part of the thalami. (b) T2 weighted spin echo sequence (SE2700/120). There is an abnormally long low signal intensity within the posterior limb of the internal capsule (arrow). This is inappropriate for a 12-day-old infant. There are abnormal low and high signal intensities throughout the basal ganglia and thalami. Diffusion weighted imaging in the same infant aged 12 days (c), (d), (e). There is high signal intensity within the posterior limb of the internal capsule (arrow) in each of the three planes of sensitization. The signal intensity on the through plane sensitization (e) should be low. This implies a loss of anisotropy within the internal capsule white matter tracts, consistent with cytotoxic edema. (f) Normal histological appearances of the posterior limb of the internal capsule (H&E). (g) Abnormal appearances in the infant with stage III HIE, who died at 2 weeks of age. There are abnormal edematous areas throughout the section. An increased water content within the internal capsule would lower its signal intensity on a T1 weighted image and increase its signal intensity on a T2 weighted image, as seen on the conventional imaging in (a) and (b). The diffusion weighted imaging changes are consistent with this edema being cytotoxic.
THE BASAL GANGLIA AND THALAMI
The basal ganglia include the head of the caudate nucleus, the globus pallidum and the putamen, which together form the lentiform nucleus (Fig. 6.5).
Using T1 weighted imaging there is high signal within the PLIC and some high signal within the ventro-lateral nuclei of the thalami. Some high signal may be seen in the globus pallidum at term and this may be exaggerated in infants with asphyxia.
Using T2 weighted imaging the ventro-lateral nuclei of the thalami are seen as low signal intensity. Myelin within the posterior limb is seen as a small area of low signal intensity within a high signal intensity capsule. There may be a thin region of low signal intensity along the lateral borders of the lentiform nucleus.
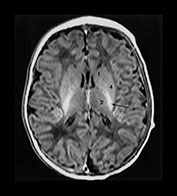
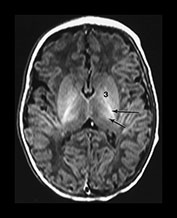
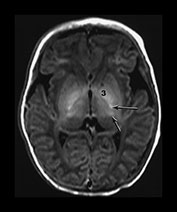
Fig. 6.5 Magnified view of the normal basal ganglia and thalami. Inversion recovery sequence (IR 3800/30/950). (a) Upper basal ganglia level; (b) mid-basal ganglia level; (c) low basal ganglia and thalamic level. Normal appearance of the basal ganglia and thalami at term. Posterior limb of the internal capsule (long arrow); ventro-lateral nucleus of the thalamus (short arrow); 1, caudate head; 2, thalami; 3, globus pallidum; 4, putamen. Note that there is a diffuse slightly increased signal in the globus pallidum, most marked inferiorly. This is very dependent on the windowing used.
Abnormal signal within the basal ganglia and thalami
Abnormalities within the basal ganglia and thalami are a frequent finding following severe acute asphyxia. This is thought to be due to the increased metabolic rate of this region which is actively myelinating at term11. In addition, the structures contain a high proportion of excitatory amino acid receptors. Abnormal signal intensity is most frequently seen within the posterior part of the lentiform nucleus and in the region of the ventro-lateral nuclei of the thalami (Figs 6.5 and 6.18) In severe injury there may be diffuse abnormality throughout the structures. We grade these basal ganglia and thalamic lesions as mild, moderate, and severe. Mild lesions are focal and seen in the presence of a normal signal intensity within the PLIC. They are typically inferior in position. Moderate lesions are focal involving the posterior and lateral lentiform nucleus and lateral thalamus with an equivocal or abnormal signal intensity within the PLIC. Severe lesions are more widespread involving all areas including the caudate head with very severe diffuse lesions and extending into the mid-brain and mesencephalon. They are always associated with an abnormal signal intensity within the PLIC. The exact signal intensity and site of lesions within the basal ganglia may vary between individual infants (Fig. 6.6). Whilst areas of abnormal high signal intensity on T1 weighted images are usually seen as low signal intensity on T2 weighted images (Fig. 6.6) in some cases the signal intensity on T2 weighted imaging is more heterogeneous (Fig. 6.6). The reasons for this are not clear and may only be explained by very detailed imaging and pathological comparisons.
Abnormalities within the corticospinal tracts around the central fissure, the hippocampus (Fig. 6.19, Case 6.5) and brain stem (Fig. 6.8) often accompany abnormalities within the basal ganglia and thalami27, 28, 30 .
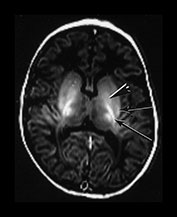
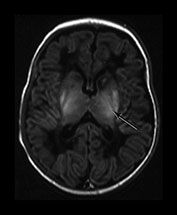


Fig. 6.6 Abnormal signal intensity within the basal ganglia and thalami. The abnormal appearances vary between infants, time from insult and with the windowing of the images but can be divided into three groups of increasing severity. Inversion recovery sequence (IR 3800/30/950). (a) Mild abnormalities with normal SI in the PLIC (long arrow). There is abnormal increased signal intensity in the ventro-lateral thalamic nuclei and in the lateral putamen (short arrow). There is obvious but probably normal high signal intensity within the globus pallidum (black and white arrowhead). This image has been quite tightly windowed. (b) Moderate, focal lesions with equivocal (i) or abnormal (ii) SI in the PLIC; (i) shows a normal signal intensity within the PLIC on the right but a rather thin signal intensity on the left which is associated with a parallel low signal intensity. Both images show abnormal high signal intensity within the lateral putamen and the lateral thalamic nuclei. In (ii) there is additional high signal more medially in the globus pallidum (long arrow) and a discrete rounded high signal intensity in the medial thalamus (short arrow). (c) Severe, widespread lesions with abnormal SI within the PLIC. (i) T1 weighted spin echo sequence
Evolution
Abnormal signal intensity with the basal ganglia and thalami gradually increases over the first week of life. By 2 weeks it is at its most obvious. In mild or moderate abnormalities of the basal ganglia the abnormal signal intensity becomes gradually less obvious and between 3 and 9 months there may be no detectable abnormalities. The lentiform nuclei and thalami may be slightly atrophied but this may not be obvious on visual analysis of the images alone. From 9 months there may be abnormal increased signal intensity within the thalami and posterior putamen. On T1 weighted images there may be additional low signal intensity in the posterior putamen but abnormal low signal intensity in the thalami may only be very subtle. The disappearance of clinically significant lesions is very important. Infants may still develop severe motor impairment despite the apparently normal imaging appearance at around 6 months of age (Fig. 6.7).
In more severe injury to the basal ganglia and thalami, from 2 weeks onwards, there is focal or diffuse atrophy with or without the formation of cysts. The high signal intensity on T1 weighted imaging gradually decreases over the first year of life when the basal ganglia and thalami may show varying degrees of atrophy (cases 6.3–6.5). Infants with multifocal or diffuse lesions within the basal ganglia and thalami also have progressive white matter atrophy. The white matter may have an initial streaky appearance. It is unclear whether this atrophy is due to the initial insult or secondary to the severe damage to the basal ganglia. The atrophy may result from the severence of preformed thalamo-cortical projections which then fail to reconnect and develop. The ability of the basal ganglia and thalami to produce or receive new connections may also be impaired.
Associated abnormalities within the hippocampus are usually not evident until the second week of life when a generalized high signal intensity is seen on T1 weighted images (Fig. 6.19, case 6.4). This is associated with later atrophy and dilation of the temporal horn of the lateral ventricles (Fig. 6.19, case 6.4).
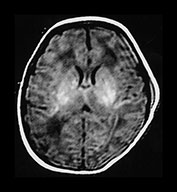


Fig. 6.7 ‘Disappearing’ abnormalities in the basal ganglia and thalami. T1 weighted spin echo sequence (SE 860/20) of a term infant with stage II HIE. Some motion artifact (a) At 4 days of age there are abnormal high signal intensities within the lentiform and thalami. The signal intensity within the PLIC is difficult to differentiate on either side and is definitely abnormal on the right. (b) At 2 months of age there are no residual abnormal signal intensities within the lentiform or thalami. Myelination within the posterior limb of the internal capsule is incomplete and therefore delayed for 2 months of age. (c) (i) At 6 months of age there is myelin within the posterior and anterior limbs. There may be a small area of abnormally increased signal intensity in the lateral thalami, in the region of the ventro-lateral nucleus (arrow) but no other abnormalities. There is no obvious cyst formation in the posterior putamen. (c) (ii) T2 weighted fast spin echo. There are no abnormal signal intensities within the basal ganglia and thalami. The brain looks slightly atrophic but atrophy of the basal ganglia and thalami is not obvious by visual analysis alone. This infant has a significant motor impairment at 1 year of age.
Pathology (see Chapter 5)
Lesions with a short T1 and short T2 are generally assumed to be hemorrhagic but we have not demonstrated macroscopic hemorrhage in infants who have died following severe basal ganglia and thalamic injury. There is, however, diffuse necrosis in these infants. Capillary proliferation occurs within hours of ischemic injury and this may give rise to the short T1 and short T2 lesions seen on MRI. In addition, the combination of very short T1 and very short T2 may be due to neuronal mineralization (Fig. 6.15). Other possible explanations for the abnormal signal intensity are iron deposition15, the presence of lipids as a by-product of membrane break down, or at a later state of abnormal myelin. Histology of the basal ganglia and thalami in children with a history of birth asphyxia, who die later in infancy or childhood, may show signs of ‘status marmoratus’ due to abnormally myelinated fibers24. The MR appearances of histologically proven ‘status marmoratus’ have not been described, perhaps, in part, because of the difficulties in obtaining consent for postmortem in older infants and children (case 6.5).
The bilateral abnormalities seen in term infants with severe HIE need to be distinguished from primary thalamic hemorrhage which may rarely be bilateral (see Chapter 9).
Clinical outcome
Lesions within the basal ganglia and thalami can be scored. The severity of the score is directly related to the outcome of the infant6, 33, 35 . Infants with persistent abnormal signal intensity all have some abnormalities at follow-up. The outcome with mild lesions with preservation of the signal from myelin in the PLIC is not clear, although these infants may show mildly abnormal tone during the first year and later develop a tremor in early childhood. More marked movement disorders may develop in adolescents with a history of perinatal asphyxia but imaging data were not available for these cases37. Moderate focal lesions that evolve to small cyst formation in the posterior part of the putamen and areas of increased T2 in the region of the ventro-lateral nuclei of the thalami are associated with the development of a fairly pure athetoid quadriplegia with normal head growth and intellectual preservation (case 6.3)32. More extensive severe multifocal abnormalities are associated with a mixed spastic/athetoid quadriplegia with a secondary microcephaly, some intellectual deficit and often persistent convulsions (case 6.4). Diffuse abnormalities resulting in severe atrophy throughout the basal ganglia and thalami are associated with the development of a spastic quadriplegia, secondary microcephaly, severe intellectual deficit and persistent convulsions, which are often difficult to control. There are additional marked feeding difficulties which usually necessitate the insertion of a gastrostomy (Fig. 6.20, case 6.5). These infants may have involvement of the mid-brain, with a diffuse increased signal on T1 weighted imaging, but this is not always easy to detect. In some infants obvious infarction of the dorsal brain stem can be identified. These infants may survive for a surprisingly long time (Fig. 6.8b).
BRAIN STEM LESIONS
Infants that develop stage III hypoxic–ischemic encephalopathy usually have severe basal ganglia lesions with extension into the mid-brain, pons and medulla. The site of lesions within the brain stem is usually dorsal. These findings explain the clinical state of an unrousable infant with no gag reflex, no facial expression and no normal eye movements. These infants are usually, but not always, unable to breathe independently. The brain stem lesions may be seen as low signal intensity on T1 weighted images and high signal intensity on T2 weighted images. These changes are consistent with infarction (Fig. 6.8). Sometimes a diffuse abnormal signal intensity is seen, high on T1 and low on T2 weighted images. Brain stem lesions are usually associated lesions in the basal ganglia and thalami, in the hippocampus and in the corticospinal tracts around the central fissure.
THE CORTEX
The newborn cortex has a relatively short T1 and T2 compared to adjacent white matter. This difference lasts for approximately 3 months. A gradual lengthening of the T1 and T2 probably reflects the density of white matter processes and synapses increasing with age. This occurs with a simultaneous decrease in the T1 and T2 of the adjacent subcortical white matter (see Chapter 4).
Cortical highlighting
Following perinatal asphyxia areas of cortex may show abnormal highlighting with a further shortening of both T1 and T2. We have termed it highlighting as it is easiest to identify on T1 weighted images where it is demonstrated as areas of abnormal high signal intensity. The abnormal cortex may have a low signal intensity on T2 weighted sequences but this is usually much less obvious (Fig. 6.9b). The cortical highlighting is most frequently seen around the central fissure where it can be the only abnormality on imaging in mild asphyxia (Fig. 6.9a). The cortex around the interhemispheric fissure (Fig. 6.9a,c). and the insula (Fig. 6.9b) may also be involved and in extreme cases almost the entire cortex may be abnormally highlighted (Fig. 6.22, case 6.7). The depths of the sulci are more frequently affected (Fig. 6.9).


Fig. 6.8 Brain stem lesions. Term infant with stage III HIE. (a) Inversion recovery sequence (IR 3500/30/950). There are bilateral abnormal low signal intensity lesions within the pons (arrow) (i) and in the medulla (ii). (b) Term infant with stage III HIE who required no ventilatory support and subsequently survived for 1 year. T2 weighted sequence. There are bilateral high signal intensity areas consistent with infarction in the brain stem (arrow).
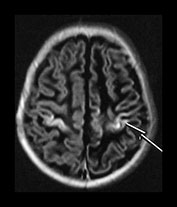
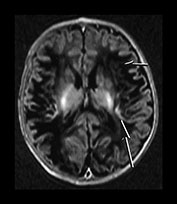


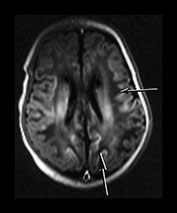
Fig. 6.9 Cortical highlighting. IR recovery sequence (IR 3800/30/950). (a) Mild highlighting (grade 1) around central fissure (arrow) with a small amount along the interhemispheric fissure. (b) Moderate highlighting (grade 2). IR recovery sequence (IR 3800/30/950). (i) Insular highlighting is seen as areas of high signal intensity in the cortex (long arrow). There are widespread areas of very low signal intensity within the white matter (short arrow). (ii) T2 weighted spin echo sequence (SE 2700/120). The areas of abnormal cortex are seen as low signal intensity (arrow) but are much less obvious than on the inversion recovery sequence. The white matter has widespread areas of abnormal high signal intensity. (c) Widespread highlighting (grade 3) shown at the level of the centrum semiovale (i) and mid-ventricular level (ii). There is abnormal low signal intensity in the subcortical white matter adjacent to the highlighted cortex (arrows) (ii).
Evolution
The abnormal signal may take several days to develop, reaching its maximum during the second week after the asphyxial insult and lasting for several weeks. During the second week abnormal signal intensity may develop in the subcortical white matter adjacent to areas of highlighted cortex (Fig. 6.9). This is consistent with ischemic damage to the white matter, which then proceeds to break down and atrophy. Early changes in the subcortical white matter can be detected with diffusion weighted imaging (Fig. 6.10).
Barkovich describes the appearances of ‘cortical edema’ on proton density images in the first few days following delivery at a time when the heavily T2 weighted images may be normal6. This finding is consistent with a loss of gray/white matter differentiation. The value of the proton density image will depend on how much gray/white matter contrast the sequence produces in the normal neonatal brain. This may differ between systems and sequences.
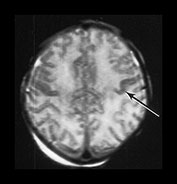


Fig. 6.10 Subcortical white matter abnormalities. (a) T2 weighted spin echo sequence (SE 2700/120) aged 2 days. There is some low signal intensity in the cortex of the central fissure (arrow). (b) Diffusion weighted imaging on the same day. There is marked increased signal intensity within the subcortical white matter (arrow). (c) T1 weighted spin echo sequence (SE 860/20). Sagittal plane. At 1 month of age there are widespread areas of abnormal low subcortical signal intensity consistent with infarction (long arrow) there are some residual areas of cortical highlighting (short arrow) and the cortex is very thin superiorly. There is abnormal signal intensity within the basal ganglia and thalami. There is a residual subdural hemorrhage behind the cerebellum.
Pathology
The abnormalities within the cortex on conventional imaging may represent ischemia of one or all cortical layers giving rise to laminar necrosis. The deep layers of the cortex are known to be more vulnerable to hypoxic–ischemic injury. It is unclear why necrosis of the cortex should give rise to a decrease in T1 and T2 but these changes probably reflect capillary proliferation at the cortical/white matter boundary (see Chapter 5). Capillary proliferation occurs after approximately 3 days following infarction, the timing fits with the first appearances of cortical highlighting on MRI. The subcortical white matter changes are consistent with infarction resulting from the primary injury. This may be as a result of a direct insult to the white matter or may be secondary to the damage in the deep layers of the cortex. The low signal intensity representing breakdown of the tissue takes at least 1 week to appear on conventional imaging.
Outcome
Cortical highlighting is usually associated with other lesions in the brain and therefore it is difficult to identify specific neurodevelopmental sequelae. Minor degrees of highlighting may be associated with a normal outcome although long-term follow-up is necessary to identify the presence of more subtle cognitive deficits. Widespread highlighting has been associated with the development of a spastic diplegia, microcephaly and moderate intellectual deficit, but without continuing convulsions (case 6.7). These findings may in part be secondary to the associated white matter abnormalities. Later imaging of the cortex is difficult although cortical structures clearly remain even after extensive highlighting. Abnormal signal intensity presumed to be secondary to laminar necrosis of the cortex has been reported in older children with cerebral palsy40 but we have been unable to identify this sort of detail with conventional imaging.
GRAY/WHITE MATTER DIFFERENTIATION
The normal-term brain shows good differentiation between cortical gray and adjacent white matter (Fig. 6.2). This is apparent for the first 3 months of life by which time the T1 and T2 of the white matter have decreased and the T1 and T2 of the cortex have increased and the differentiation is less obvious.
Loss of gray/white matter differentiation
Focal infarction in isolation is not a typical finding in HIE but may accompany other lesions. Infarction in infants with HIE is usually bilateral and in a parasagittal distribution, with more marked changes posteriorly. The loss of differentiation results from a change in the normal signal intensity within the cortex and the white matter. The cortex loses its typical short T1 short T2 properties. Barkovich attributes this to cortical edema and reports that this sign may be detected earliest using a proton density image6. Whilst the T1 and T2 values of the cortex lengthen with infarction so do those in the white matter. Some loss of differentiation may be seen on T1 weighted spin echo images in the presence of brain swelling but this may normalize to reveal an intact brain. If there is additional loss of differentiation on an inversion recovery, or on T2 weighted sequence, then this represents impending infarction. Regions with loss of differentiation may be easily identified with diffusion weighted imaging which shows a pattern consistent with restricted diffusion for the first week of life, becoming less obvious as conventional imaging becomes more abnormal (Fig. 6.11).
During the second week the gray/white matter differentiation returns but is exaggerated due to a shortening of the T1 and T2 in the cortex, perhaps secondary to capillary proliferation, and an increase in T1 and T2 in the white matter (Fig. 6.11).

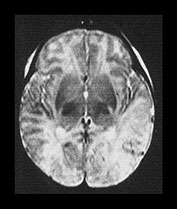


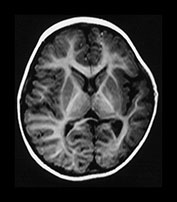

Fig. 6.11 Loss of gray/white matter differentiation. (a) Female infant with stage II HIE. Imaged at 3 days of age. (i) T1 weighted spin echo sequence (SE 860/20). There is a complete loss of the normal gray/white matter differentiation in the posterior parietal and occipital lobes. This is consistent with extensive infarction in both parietal lobes. The basal ganglia and thalami appear normal and there is normal high signal from myelin in the posterior limb of the basal ganglia. (ii) T2 weighted spin echo sequence (SE 2700/120). There is loss of the normal low signal from the cortex and some increase in the signal intensity within the white matter in both temporal and occipital poles. (iii) Diffusion weighted imaging. There is abnormal high signal intensity within the temporal and occipital lobes. This is consistent with restricted diffusion of water. (b) Inversion recovery sequence (IR 3800/30/950). Imaged at 2 weeks. There is now exaggerated differentiation between the cortex, which is abnormally highlighted, and the white matter which has abnormal low signal intensity. (c) Inversion recovery sequence (IR 3600/30/850). Imaged at 1 year of age. There is atrophy of both temporal lobes with decreased myelin, which is more marked on the left. (d) FLAIR (fluid attenuated IR 6500/160/2100) sequence at 2 years of age. There is abnormal high signal intensity (arrows) consistent with glial tissue in both temporal and occipital lobes. At age 2 years this infant was microcephalic but with only minimal asymmetry of tone. At 4 years she had a short attention span and poor concentration which made assessment difficult but her general development was only at the 3-year level.
Pathology
The loss of differentiation is a result of cytotoxic edema resulting from severe ischemia, as seen in areas of focal infarction (see Chapter 7). Diffusion weighted imaging confirms the presence of infarction10, 29. The exaggeration of the cortical signal during the second week of life with a shortening of the T1 and T2 may also represent capillary proliferation.
Neurodevelopmental outcome
The clinical outcome in infants that show loss of gray/white matter differentiation preceding infarction depends on the extent and site of the infarction, the presence of other lesions and additional underlying diagnoses. In the absence of basal ganglia lesions the motor outcome may be surprisingly good even with extensive white matter loss (Fig. 6.11). Marked cystic breakdown within the white matter may be accompanied by severe basal ganglia lesions. The outcome in these infants is very poor (Fig. 6.23, case 6.8).
THE CEREBELLUM
Conventional MRI is able to detect abnormalities in the regions of the brain described but may not detect changes in other areas of the brain which have nonetheless been damaged.
The cerebellum appears to be relatively resistant to hypoxic–ischemic damage. In infants with widespread destruction of all other areas of the brain the cerebellum may remain intact and look relatively normal (Fig. 6.12). Certain regions of the cerebellum, for example the dentate nucleus, are reported in animal studies as being sensitive to asphyxial damage. Changes in the dentate nucleus are difficult to identify with MRI. The visualization of these structures is angle dependent in the transverse plane. Abnormalities probably represent an exaggeration of the normal low and high signal intensity. In a study comparing MRI to histological appearances following severe birth asphyxia we were unable to detect any abnormal signal intensity within the dentate nucleus although at histology the dentate was classified as abnormal in every infant18 (Fig. 6.13).
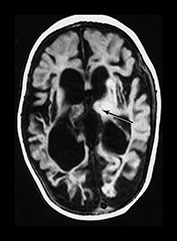

Fig. 6.12 Cerebellar preservation. Infant with stage II HIE, case 6.8, imaged at 7 months. Inversion recovery sequence (IR 3400/30/800). Transverse plane. (a) Low ventricular level. There is widespread cystic breakdown of the hemispheres and marked atrophy of the basal ganglia and thalami (arrow).

Fig. 6.13 Dentate nuclei. Infant with stage II HIE who died. There is an exaggeration of the normal high signal around the dentate nuclei (arrow). This is subjective and dependent on the windowing of the images. The cerebellum was histologically abnormal with neuronal necrosis within the dentate nuclei and Purkinje cells.
We have used a computer quantification program to measure cerebellar hemisphere volume and vermis volume. Both parameters were reduced in infants with severe basal ganglia and thalamic lesions, along with their total brain volume; however, the reduction in vermal volume was more marked22. It is not clear whether this atrophy results from initial undetected lesions in the cerebellum or whether it represents a secondary atrophy or degeneration.
The majority of infants with HIE survive. In those that die it may not have been possible to get detailed imaging prior to death. There is therefore very little correlation between ultrasound or MRI and histology16, 18. The use of pathological terms to describe MR findings is common practice but may hinder our understanding and cause confusion between different clinical and research groups.
< prev | top | contents | next >
Pattern recognition, scoring systems and prediction of outcome in term infants with HIE
Many authors have described scoring systems for the pattern of injury detected on early MRI following birth asphyxia6, 21, 33, 35 . These scoring systems are useful for classifying lesions for research studies. Many of them, however, are too complicated for routine clinical use. MRI has a vital role in the prediction of outcome but correct interpretation of imaging findings is not easy. MRI should never be used as a sole technique for prediction of outcome and the subsequent altering of clinical management. In addition, the prediction of an abnormal outcome is only the first step. The definition of abnormal outcome differs between studies and is often not very specific. MRI in the neonatal period is able, unlike other neurological investigations, to give precise details on the type of abnormal outcome. Some abnormal outcomes may not be severe enough to warrant the possible complications inherent in any early intervention, for example hypothermia, when these become more widely available. MRI provides invaluable information on the patterns and evolution of injury following HIE. This information will prove vital for monitoring the effects, both desired and not, of any future interventions. Interestingly, in a small pilot group of term infants with severe HIE who were treated with hypothermia we had an incidence of hemorrhagic/ thrombotic cerebral complications of approximately 20%, compared to approximately 5% in our long-term cohort of untreated infants. This may reflect bias from our patient selection with the treated group representing the severe end of the spectrum of infants with HIE, but warrants further investigation.
< prev | top | contents | next >
The preterm asphyxiated brain
Ischemic lesions within the preterm brain are discussed elsewhere (see Chapter 8). The pattern of injury seen in the preterm brain will, as in the term infant, depend on the nature of the insult and probably to a lesser extent to the gestational age of the fetus or infant. Severe acute insults which often correspond to a well-documented clinical event, for example attempted maternal suicide, result in injury to the basal ganglia and thalami (Fig. 6.14). The specific regions within the basal ganglia and thalami may be different from the term asphyxiated brain4, 5. In addition, cortical highlighting is not obvious around the central sulcus in the preterm brain, perhaps reflecting less metabolic activity and therefore less vulnerability. These severe events may occur following delivery (Fig. 6.15) but with good neonatal intensive care are relatively rare. The more common injury seen in the preterm brain is to white matter probably because of the type of insult to which preterm infants are exposed, for example sepsis and chronic hypoxia13 and because the developing white matter is particularly vulnerable. The type of insult may, however, be a major determinant of the eventual injury as term-born infants with a history of a chronic or repetitive injury or possible sepsis will also show mainly white matter damage.
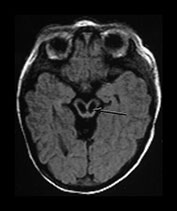
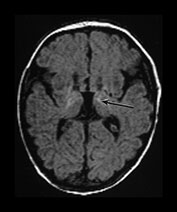
Fig. 6.14 Antenatal brain stem infarction. Female infant born at 41 weeks’ gestation with arthrogryposis multiplex congenita. Her mother took an overdose of co-proxamol at 22 weeks’ gestation. This was associated with maternal convulsions and a period of hypotension. She also abused cocaine and alcohol during the pregnancy. T1 weighted spin echo sequence (SE 860/20). Imaged at 8 days of age. (a) There are bilateral infarcts within the mesencephalon (arrow). (b) The basal ganglia and thalami are atrophied and the normal anatomy distorted; there is also abnormal linear increased signal intensity within the thalami (arrow).

Fig. 6.15 Acute hypoxic–ischemic injury in a preterm infant. Male infant born at 28 weeks’ gestation who had a severe collapse at 30 weeks. Imaged postmortem at 32 weeks. T1 weighted spin echo sequence
< prev | top | contents | next >
Case histories
CASE 6.1. NO FOCAL LESIONS (Fig. 6.16)
This female infant was born by ventouse delivery at 40 weeks’ gestation, following an uneventful pregnancy. Prior to delivery there was prolonged rupture of membranes and maternal pyrexia, with a fetal tachycardia and fresh meconium-stained liquor. The infant had Apgar scores of 3 at 1min and 7 at 5min. The cord pH was 6.7. She had a single documented clinical convulsion but an EEG showed good background activity. She was classified as having stage II HIE.
Neurodevelopmental follow-up
Her development was within normal limits at 4.5 years of age.
• Normal MR images at the end of the first week are associated with a normal neurodevelopmental outcome at school entry.
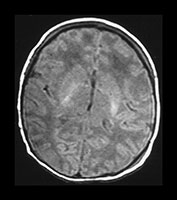

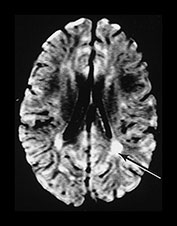
Fig. 6.16 Case 6.1. (a) T1 weighted spin echo sequence (SE 860/20). Aged 2 days. There is moderate brain swelling but preservation of the gray/white matter differentiation. There is a normal signal from myelin in the posterior limb of the internal capsule. (b) Aged 18 months. T2 weighted spin echo sequence (SE 2700/120). There is mild dilatation of the ventricles right more than left. There is a small amount of increased signal intensity in the periventricular white matter bilaterally, which is most marked posteriorly (arrow). This is in the region of the terminal zones and may just represent unmyelinated white matter, although it does have a high signal intensity on the FLAIR (fluid attenuated IR 6500/160/2100) sequence (arrow)(c).
CASE 6.2. MILD BASAL GANGLIA AND THALAMIC LESIONS (Fig. 6.17)
This female infant was born at 40 weeks’ gestation by normal vaginal delivery with a birth weight of 3.45kg. There was fetal distress with type II dips for approximately 20min prior to delivery. Apgar scores were 1 at 1min and she required intubation for poor respiratory effort. She had clinical convulsions on day 2 that required phenobarbital. She was classified as stage II HIE.
Neurodevelopmental follow-up
She is now 5 years old and is developmentally normal. She has an obvious tremor that interferes with her fine motor function.
• Mild basal ganglia and thalamic abnormalities may be associated with late-onset motor abnormalities, for example tremor or possibly dystonia.

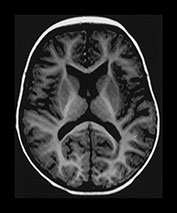

Fig. 6.17 Case 6.2. (a) Inversion recovery sequence (IR 3800/30/950). Imaged at 5 days of age. There is abnormal high signal intensity within the thalami and putamen. There is excessive high signal in the region of the posterior limb of the internal capsule. This may be due, in part, to overtight windowing of the image. (b) Inversion recovery sequence (IR 3600/30/850), and (c) T2 weighted spin echo sequence (SE 2700/120). Aged 9 months. The basal ganglia and thalami are of normal appearance on both image sequences.
CASE 6.3. MODERATE BASAL GANGLIA AND THALAMIC LESIONS (Fig. 6.18)
This female infant was born at 41 weeks’ gestation by forceps delivery with a birth weight of 3.2kg. Her mother was a primigravida and the pregnancy was uneventful, except for transient proteinuria at 34 weeks’ gestation. Apgar scores were 3 at 1min and 3 at 5min. The umbilical cord pH was 7.13. She required ventilation for 5h. Abnormal movements were noted at 1h of age. She was classified as having stage II HIE.
Neurodevelopmental follow-up
At 4 years of age she has an athetoid cerebral palsy. She is able to take some steps using a walking aid. She is dysarthric but is of above average intelligence.
• Moderate focal basal ganglia lesions are associated with the development of athetoid quadriplegia. There is usually good head growth and normal intelligence.

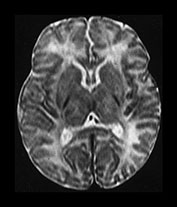


Fig. 6.18 Case 6.3. (a) Imaged at 5 days. Low ventricular level. (i) Inversion recovery sequence (IR 3800/30/950). There is abnormal signal intensity within the lentiform, posteriorly and anteriorly (arrowhead) and in the region of the ventro-lateral thalamic nuclei (short arrow). The signal intensity from myelin is present (long arrow) but associated with a parallel low signal intensity. (ii) T2 weighted spin echo sequence (SE 2700/120). The low signal representing myelin in the posterior limb of the internal capsule is slightly excessive for a conventional T2 weighted spin echo. It is difficult to see the abnormal signal intensities within the lentiform nuclei and thalami. (b) Centrum semiovale. Inversion recovery sequence (IR 3800/30/950). There is cortical highlighting, most obvious around the central fissure (arrow). (c) Imaged at 1 year of age. Low ventricular level. (i) Inversion recovery sequence (IR 3400/30/800). There are small low signal intensity lesions in the posterior putamen (arrow) consistent with cysts. (ii) T2 weighted spin echo sequence (SE 2700/120). There are areas of abnormal high signal intensity in the posterior putamen (long arrow) and in the lateral thalamus (short arrow). The lateral border of the putamen is flattened indicating atrophy. (d) Centrum semiovale. T2 weighted spin echo sequence (SE 2700/120). There is high signal intensity around the central fissure at the site of the previous cortical highlighting in (b).
CASE 6.4. SEVERE BASAL GANGLIA AND THALAMIC LESIONS (Fig. 6.19)
This male infant was born at 42 weeks’ gestation by forceps delivery with a birth weight of 4kg. His mother was a primigravida and her pregnancy was uneventful. There was meconium-stained liquor following spontaneous rupture of membranes. Some decelerations were noted on the cardiotocogram (CTG). Apgar scores were 0 at 1min, and 1 at 10min. Abnormal movements were noted at 1.5h of age. He was classified as having stage II HIE. He was ventilated for 3 days.
Neurodevelopmental follow-up
He had severe feeding difficulties that required nasogastric tube feeding until approximately 8 months of age. At 4 years of age he is microcephalic and has a mixed quadriplegia with athetoid movements of his face and arms and marked spasticity in his legs. He has no speech but communicates with hand and eye movements. He is unable to sit independently. He has a moderate intellectual deficit. He has developed epilepsy and requires anticonvulsants.
• Severe basal ganglia and thalamic lesions are associated with the development of a secondary microcephaly, in the absence of cystic white matter breakdown. The more extensive the basal ganglia and thalamic lesions, the more likely the development of a spastic cerebral palsy. Feeding difficulties are also more likely but may improve with age. Intelligence is unlikely to be normal. Convulsions may re-occur during infancy or childhood.
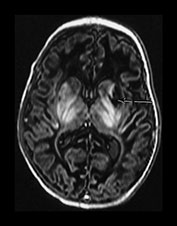


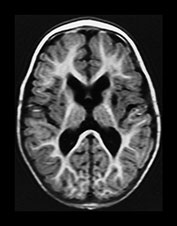


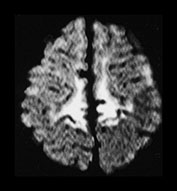

Fig. 6.19 Case 6.4. Aged 13 days. (a) Low ventricular level. (i) Inversion recovery sequence (IR 3800/30/950). There is abnormal signal intensity throughout the basal ganglia and thalami. There is a cyst in the anterior lentiform nucleus and caudate head on the left (arrow). There is some high signal in the region of the internal capsule but this is too long for normal myelination and is accompanied by a parallel low signal intensity. There is cortical highlighting within the insula with abnormal low signal intensity in the adjacent subcortical white matter. (ii) T2 weighted spin echo sequence (SE 2700/120). There are marked abnormal low and high signal intensities throughout the lentiform nuclei. The cyst is seen as high signal intensity on the left. The abnormal signal in the thalami is less obvious than on the T1 weighted images and the signal from myelin in the posterior limb of the internal capsule is relatively normal posteriorly but can be seen to extend anteriorly particularly on the left (arrow). This would be too excessive for normal myelination. (b) Centrum semiovale. Inversion recovery sequence (IR 3800/30/950). There is extensive cortical highlighting higher up the brain at the level of the centrum semiovale and most marked around the central fissure. There is widespread low signal intensity in the white matter. (c) Hippocampal level. There is abnormal high signal intensity in the medial temporal lobe in the region of the hippocampus (arrow). (d) Aged 13 months. Low ventricular level. (i) Inversion recovery sequence (IR 3400/30/800). There is marked atrophy of the hemispheres and the basal ganglia and thalami. There is now high signal intensity consistent with myelin in the posterior limb of the internal capsule. In addition there is myelin throughout the brain but this is deficient for this age and very thin. The cyst remains on the left. (ii) T2 weighted spin echo sequence (SE 2700/120). There is abnormal high signal intensity along the lateral border of the atrophied lentiform nuclei. There is additional abnormal high signal intensity within the thalami. There is some low signal intensity consistent with myelin in the posterior limb of the internal capsule and in the anterior and posterior corpus callosum. (iii) FLAIR sequence (fluid attenuated IR 6500/160/2100). Areas of increased signal intensity consistent with gliosis are more prominent than on the T2 weighted images. (e) Centrum semiovale. (i) T2 weighted spin echo sequence (SE 2700/120). There is abnormal high signal intensity in a ‘bats wing’ pattern in the centrum semiovale and the site of the previous cortical highlighting and abnormal low signal in the subcortical white matter (see b). (ii) FLAIR sequence (fluid attenuated IR 6500/160/2100). The high signal intensity consistent with gliosis is more marked than on the T2 weighted images. (f) Hippocampal level. FLAIR sequence (fluid attenuated IR 6500/160/2100). There is atrophy with dilation of the temporal horns of the lateral ventricles. There is abnormal increased signal intensity consistent with gliosis (arrow).
CASE 6.5. VERY SEVERE DIFFUSE BASAL GANGLIA AND THALAMIC LESIONS (Fig. 6.20)
This female infant was born at 39+ weeks’ gestation by emergency cesarian section following a failed forceps and failed ventouse delivery. Her mother was a primigravida and her pregnancy was uneventful. There was marked fetal distress and a cord prolapse during a forceps delivery. She was eventually delivered by cesarian section. Apgar scores were 2 at 1min and 5 at 5min. The birth weight was 3.8kg. The infant was ventilated for 12h. She developed convulsions at 18h and was reventilated until day 4. An EEG showed a supressed background with seizure activity. She was classified as having stage II HIE.
Neurodevelopmental outcome
This little girl developed a spastic quadriplegia with extensor posturing and severe microcephaly. She had persistent difficulties with sucking and swallowing and required the insertion of a gastrostomy tube. She had frequent convulsions which were difficult to control. She died from respiratory complications at 3 years of age.
• Very severe diffuse basal ganglia and thalamic lesions are associated with a very poor neurodevelopmental outcome or early death. There are usually severe feeding difficulties and on-going convulsions. Involvement of the mid-brain and brain stem may be obvious on MR imaging.
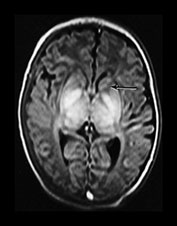


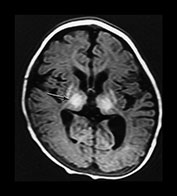
Fig. 6.20 Case 6.5. (a) Aged 10 days. Inversion recovery sequence (IR 3800/30/950). There is abnormal signal intensity throughout the thalami, the putamen and the globus pallidum. There is a low signal intensity running along the posterior limb of the internal capsule. There is a very low signal intensity in the anterior limb of the internal capsule (arrow). There are widespread areas of cortical highlighting and the white matter has an abnormal low signal intensity. There has been resolution of previously documented brain swelling. (b) Aged 3 weeks. Transverse plane. Inversion recovery sequence (IR 3800/30/950). (i) Low ventricular level. The abnormal high and low signal intensity within the basal ganglia and thalami are at their most obvious. The low signal probably represents cyst formation. (ii) Hippocampal level. There is abnormal high signal intensity within the medial temporal lobe (arrows). There is abnormal high and low signal intensity within the brainstem. (c) Aged 6 months. Inversion recovery sequence (IR 3600/30/700). There is marked plagiocephaly. There is severe atrophy of the white matter and basal ganglia and thalami. There is some high signal in the internal capsule consistent with myelin but this is not normal in appearance (arrow). There is abnormal high signal intensity throughout the thalamus and in the atrophied putamen. This may represent status marmoratus. Myelination is markedly deficient throughout the brain.
CASE 6.6. WHITE MATTER INFARCTION (Fig. 6.21)
This male infant was delivered at 39+ weeks by emergency cesarian section. This was his mother’s second pregnancy. She noticed intermittent decreased fetal movements from 36 weeks. She presented at 39 weeks with decreased movements and tightenings. Meconium-stained liquor was noted following rupture of the membranes. An emergency cesarian section was performed following a fetal scalp blood sample with a pH 7.02 and decreased variability on the CTG. Apgar scores were 1 at 1min and 3 at 5min. His birth weight was 3.19kg. The infant was ventilated from 8h of age for recurrent apnea. Clinically obvious convulsions were noted from 12h of age. He was classified as having grade II HIE. He was extubated at 48h. Numerous skin pustules were noted but a septic screen was negative.
Neurodevelopmental outcome
He developed a secondary microcephaly, a strabismus and a visual field deficit. He has a dystonic posture of his right arm with poor hand function. At 6 years of age he walks independently. He has not had any further convulsions. He attends a mainstream school but has considerable learning difficulties.
• Infants with HIE who have predominantly white matter lesions usually have a more complicated antenatal course, suggesting a chronic or repetitive injury or possible sepsis. The degree of associated basal ganglia involvement probably reflects the severity of any acute perinatal asphyxia. Motor impairment is usually less severe than intellectual impairment.


Fig. 6.21 Case 6.6. (a) Aged 4 days. (i) T1 weighted spin echo sequence (SE 860/200). There is brain swelling with widespread loss of gray/white matter differentiation in the parietal and occipital lobes. There is some diffuse high signal within the basal ganglia. There are a few areas of cortical highlighting. There is a diffuse high signal intensity within the basal ganglia and thalami, partly due to tight windowing of the images. There is abnormal low signal in frontal lobes. (ii) T2 weighted spin echo sequence (SE 2700/120). There is almost complete loss of gray/white matter differentiation. There is some low signal intensity in both lentiform nuclei more marked in the lateral putamen on the right (arrow). There is no low signal from myelin within the posterior limb of the internal capsule. (b) Aged 10 days. Inversion recovery sequence (IR 3800/30/950). There is now an exaggeration of the normal gray/white matter differentiation. There is widespread highlighting of the cortex with low signal within white matter consistent with infarction. There is bilateral high signal in lentiform, globus and lateral thalami. This may be partly due to very tight windowing. Windowing images which have either very high or very low signal intensity within the brain can be very difficult. It is difficult to detect any high signal from myelin within the posterior limb of the internal capsule, although the level of the image is slightly low. (c) Aged 5 weeks. Inversion recovery sequence (IR 3800/30/950). There is extensive cyst formation throughout the white matter. The cortex appears thin. There is a small amount of high signal intensity at the base of the posterior limb consistent with myelination (arrow). (d) Aged 3 months. Inversion recovery sequence (IR 3800/30/950). (i) Low ventricular level. There is marked cystic change with atrophy of the white matter. The posterior limb is myelinated, although slightly asymmetrical. There is some myelin appearing at the anterior limb on the left. The anterior limb should be fully myelinated at 3 months. (ii) Centrum semiovale. There is extensive infarction of the posterior parietal lobes. (e) Aged 7 months. Inversion recovery sequence (IR 3800/30/950). There is widespread atrophy of the brain with decreased myelination. There is myelin in the frontal lobes which usually appears at around 6 months. Myelin has progressed in the anterior limb of the internal capsules. The basal ganglia and thalami are relatively preserved. There is some abnormal high signal intensity in the right lentiform nucleus (arrow).
CASE 6.7. WIDESPREAD CORTICAL INJURY (Fig. 6.22)
This female infant was born by emergency cesarian section at 39 weeks’ gestation. Her mother had had two previous miscarriages. During this pregnancy she had a threatened abortion at 9 weeks. An antepartum hemorrhage at 24 weeks was attributed to a low-lying placenta. She had several further bleeds until 32 weeks. She was induced at 39 weeks at which time she had a further larger bleed. There were CTG decelerations to 77, a baseline of only 105 beats/min and the trace showed poor variability. The baseline dropped to 70 beats/min just prior to delivery. Her birth weight was 4.2kg. Apgar scores were 0 at 1 minute, 2 at 5min and 3 at 10min. She developed convulsions at 24h of age. She was classified as having stage II HIE.
Neurodevelopmental outcome
This little girl developed a secondary microcephaly and a mild spastic diplegia. She walks with a rollator. She has an IQ of approximately 50.
• Cortical and white matter injury are associated with mild motor impairment usually in the form of a spastic diplegia. Intellectual impairment is more severe. Late MR images may resemble classic periventricular leukomalacia (PVL) and may be wrongly attributed to an antenatal insult, as in the preterm population. Whilst the injury in these term-born infants may be secondary to a chronic or repetitive antenatal insult the structural lesions themselves are perinatal in onset. It is possible that if these infants could be identified, an elective cesarian section prior to term may modify or even prevent the injury to the brain.
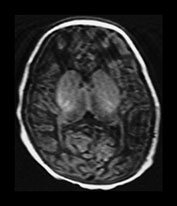
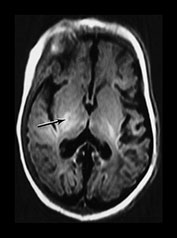
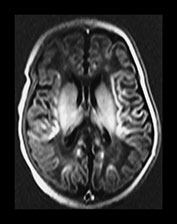
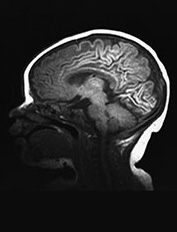


Fig. 6.22 Case 6.7. (a) Aged 3 days. T1 weighted spin echo sequence (SE 860/20). There is marked brain swelling with some loss of gray/white matter differentiation. There are multiple artifacts through the image secondary to intravenous lines. (b) Aged 18 days. Inversion recovery sequence (IR 3800/30/950). Sagittal plane. (i) Low ventricular level. There is widespread cortical highlighting. There is asymmetry of posterior limb and some high signal in right lentiform (arrow). (ii) Mid-ventricular level. There is widespread cortical highlighting and abnormal low signal intensity in the subcortical white matter. The extent of these abnormalities is well shown on the sagittal image (iii). (c) Aged 6 weeks. Inversion recovery sequence (IR 3800/30/950). (i) Mid-ventricular level. (ii) Centrum semiovale. There is marked atrophy of white matter with ventricular dilation. There is extensive high signal intensity within the cortex and white matter. This is more pronounced and diffuse than the original cortical highlighting. (d) Aged 1 year. Low ventricular level. Inversion recovery sequence (IR 3400/30/800). There is generalized atrophy of the hemispheres with a decreased amount but a normal pattern myelination. The corpus callosum is very thin posteriorly (arrow). The ventricles are not dilated. Without knowledge of the head circumference it is difficult to assess the degree of brain atrophy on these images. (e) FLAIR sequence (fluid attenuated IR 6500/160/2100). (i) Mid-ventricular level. (ii) High ventricular level. There is extensive abnormal increased T2 at the site of the previous cortical and white matter abnormalities. Despite this apparent gliosis the ventricular outline remains rounded, unlike those in more typical periventricular leukomalacia.
CASE 6.8. WIDESPREAD WHITE MATTER CYSTIC BREAKDOWN AND SEVERE BASAL GANGLIA AND THALAMIC LESIONS (Fig. 6.23)
This female infant was born by normal vaginal delivery following an uneventful pregnancy. There was some fresh meconium-stained liquor following an artificial rupture of the membranes. There were some decelerations noted on the CTG. She unexpectedly required extensive resuscitation. She developed convulsions on day 1. She was classified as stage II HIE.
Neurodevelopmental outcome
At 5 years of age she was microcephalic and had a severe spastic quadriplegia. She was fed by gastrostomy. She had seizures which required anticonvulsant medication. She showed some awareness of her surroundings but developmental progress was severely delayed.
• In some infants there is extensive cystic breakdown of the white matter and severe basal ganglia lesions. This may result from a combination of chronic repetitive injury which primes the white matter followed by a severe perinatal insult which is the final ‘insult’ for the white matter but sufficiently severe as to cause significant basal ganglia and thalamic lesions. These children have a very poor outcome but may show more awareness than those with severe basal ganglia lesions without white matter cysts. Both groups of children will develop a secondary microcephaly.
• Occasionally, infants sustain very severe damage to the brain perinatally with very little evidence of fetal distress. Further investigation to identify predisposing factors is warranted to help predict prognosis and for genetic counselling.

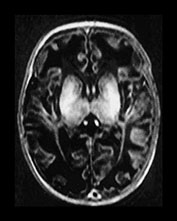

Fig. 6.23 Case 6.8. (a) Aged 3 days. Inversion recovery sequence (IR 3800/30/950). There is diffuse abnormal signal intensity within the basal ganglia and thalamus. It is difficult to identify the normal posterior limb of the internal capsule. There is generalized loss of gray/white matter differentiation. (b) Aged 6 weeks. Inversion recovery sequence (IR 3800/30/950). There is more excessive abnormal high signal intensity throughout the basal ganglia and thalami. The internal capsule is not distinguishable. There is widespread low signal intensity in the white matter consistent with infarction. The cortex appears very thin and highlighted. (c) Aged 4 months. Inversion recovery sequence (IR 3800/30/950). There is complete cystic breakdown of the white matter with marked atrophy of the basal ganglia and thalami (arrow).
< prev | top | contents | next >
Summary
- Obtain a detailed antenatal and perinatal history from both parents and professionals.
- Ensure the diagnosis of hypoxic–ischemic encephalopathy is correct. Exclude other additional causes of encephalopathy or any predisposing factors.
- Metabolic disorders may masquerade as HIE or co-exist. A metabolic screen in any infant with apparent HIE is always warranted.
- Time the imaging carefully. MR imaging within the first few days may give valuable information to plan management but be prepared to repeat if a day 1 or 2 scan is normal in an abnormal infant with HIE II or III. Image during the second week for maximum information about the pattern of injury and therefore the clinical outcome.
- Choose your sequences to detect the suspected lesions. The clinical history, neurological examination and cranial ultrasound may be useful guides.
- Severe acute injury, for example placental abruption, is usually associated with abnormalities in the basal ganglia and thalami and the posterior limb of the internal capsule. There may be additional lesions in the brain stem in severe cases. Associated hippocampal lesions are best seen during the second week.
- Marked white matter and cortical changes suggest a more chronic possibly repetitive injury, for example hypoxia – ischemia, infection, hypoglycemia. These infants often fulfill all the accepted criteria for HIE although the perinatal insult may be mild.
- Early clinical signs may give information about the pattern of injury. Infants who are breast or bottle feeding normally within 2 weeks are unlikely to have a severe lesion within the basal ganglia and thalami. They may still have a moderate or mild basal ganglia and thalamic lesion or severe white matter involvement.
- An abnormal signal within the posterior limb of the internal capsule is a good early predictor of abnormal outcome. Early diffusion weighted imaging should detect white matter infarction.
- The nature of the abnormal outcome can be determined by the extent of basal ganglia injury. In the absence of lesions within the basal ganglia and thalami the site and extent of white matter injury is important; however, if the signal intensity within the posterior limb is normal the motor outcome is likely to be normal or only mildly abnormal.
< prev | top | contents | next >
References
- Adsett DB, Fitz CR and Hill A (1985) Hypoxic–ischaemic cerebral injury in the term newborn: correlation of CT findings with neurological outcome. Dev Med Child Neurol 27, 155–160.
- Baenziger O, Martin E, Steinlin M et al. (1993) Early pattern recognition in severe perinatal asphyxia: a prospective MRI study. Neuroradiology 35, 437–442.
- Barkovich AJ (1992) MR and CT evaluation of profound neonatal and infantile asphyxia. Am J Neuroradiol 13, 959–972.
- Barkovich AJ and Sargent SK (1995) Profound asphyxia in the premature infant: imaging findings. Am J Neuroradiol 16, 1837–1846.
- Barkovich AJ and Truwit CL (1990) Brain damage from perinatal asphyxia: correlation of MR findings with gestational age. Am J Neuroradiol 11, 1087–1096.
- Barkovich AJ, Hajnal BL, Vigneron D et al. (1998a) Prediction of neuromotor outcome in perinatal asphyxia: evaluation of MR scoring systems. Am J Neuroradiol 19, 143–149.
- Barkovich AJ, Ali FA, Rowley HA et al. (1998b) Imaging patterns of neonatal hypoglycemia. Am J Neuroradiol 19, 523–528.
- Barkovich AJ, Latal-Hajnal B, Partridge JC et al. (1997) MR contrast enhancement of the normal neonatal brain. Am J Neuroradiol 18, 1713–1717.
- Byrne P, Welch R, Johnson MA (1990) Serial magnetic resonance imaging in neonatal hypoxic–ischaemic encephalopathy. J Pediatr 117, 694–700.
- Cowan FM, Pennock JM, Hanrahan JD et al. (1994) Early detection of cerebral infarction and hypoxic ischemic encephalopathy in neonates using diffusion weighted magnetic resonance imaging. Neuropediatrics 25, 172–175.
- Chugani HT and Phelps ME (1986) Maturational changes in cerebral function in infants determined by 18 FDG positron emission tomography. Science 231, 840–843.
- Cullen A, Donoghue V and King MD (1998) High attenuation gyri CT in postasphyxial encephalopathy. Ir J Med Sci 167, 193–195.
- Dammann O and Leviton A (1997) Maternal intrauterine infection, cytokines, and brain damage in the preterm newborn. Pediatr Res 42, 1–8.
- De Vries LS, Eken P, Beek E et al. (1996) The posterior fontanelle: a neglected acoustic window. Neuropediatrics 27, 101–104.
- Dietrich RB and Bradley WG Jr (1988) Iron accumulation in the basal ganglia following severe ischemic–anoxic insults in children. Radiology 168, 203–206.
- Eken P, Jansen GH, Groenendaal F et al. (1994) Intracranial lesions in the fullterm infant with hypoxic–ischaemic encephalopathy: ultrasound and autopsy correlation. Neuropediatrics 25, 301–307.
- Eken P, Toet MC, Groenendaal F et al. (1995) Predictive value of early neuroimaging, pulsed Doppler and neurophysiology in full term infants with hypoxic–ischaemic encephalopathy. Arch Dis Child Fetal Neonatal Ed 73, F75–80.
- Jouvet P, Cowan FM, Cox P et al. (1999) Reproducibility and accuracy of MR imaging of the brain after severe birth asphyxia. Am J Neuroradiol 20, 1343–1348.
- Keenay SE, Adcock EW and McArdle CB (1991) prospective observations of 100 high risk neonates by high-field (1.5 Tesla) magnetic resonance imaging of the central nervous system II. Lesions associated with hypoxic–ischaemic encephalopathy. Pediatrics 87, 431–438.
- Kinnala A, Rikalainen H, Lapinleimu H (1999) Cerebral magnetic resonance imaging and ultrasonography findings after neonatal hypoglycemia. Pediatrics 103, 724–729.
- Kuenzle C, Baenziger O, Martin E et al. (1994) Prognostic value of early MR imaging in term infants with severe perinatal asphyxia. Neuropediatrics 4, 191–200.
- Le Strange E, Saeed N, Counsell S et al. (2000) Magnetic resonance image quantification following hypoxic–ischemic injury to the neonatal brain ISMRM Denver Colorado Abstract 1928.
- Leech RW and Alvord EC (1977) Anoxic–ischemic encephalopathy in the human neonatal period. The significance of brain stem involvement. Arch Neurol 34, 109–113.
- Malamud N (1950) Status marmoratus: a form of cerebral palsy following birth injury or inflammation of the central nervous system.J Pediatrics 37, 610–619.
- Murakami Y, Yamashita Y, Matsuishi T (1999) Cranial MRI of neurologically impaired children suffering from neonatal hypoglycaemia. Pediatr Radiol 29, 23–27.
- Okuda T, Korogi Y, Ikushima I (1998) Use of fluid-attenuated inversion recovery (FLAIR) pulse sequences in perinatal hypoxic–ischaemic encephalopathy. Br J Radiol 71, 282–290.
- Pasternak JF and Goery MT (1998) The syndrome of acute near-total intrauterine asphyxia in the term infant. Pediatr Neurol 18, 391–398.
- Pasternak JF, Predey TA and Mikhael MA (1991) Neonatal asphyxia: vulnerability of basal ganglia, thalamus and brainstem. Pediatr Neurol 7, 147–149.
- Pennock JM, Cowan FM, Schweiso JE et al. (1994) Clinical role of diffusion weighted imaging: neonatal studies. Magma 2, 273–278.
- Rademaker RP, van der Knaap MS, Verbeeten B Jr et al. (1995) Central cortico-subcortical involvement: a distinct pattern of brain damage caused by perinatal and postnatal asphyxia in term infants.J Comput Assist Tomogr 19, 252–263.
- Roland EH, Hill A, Norman MG et al. (1988) Selective brainstem injury in an asphyxiated newborn. Ann Neurol 23, 89–92.
- Rutherford MA, Pennock JM, Murdoch-Eaton DM et al. (1992) Athetoid cerebral palsy and cysts in the putamen after hypoxic–ischaemic encephalopathy. Arch Dis Child 67, 846–850.
- Rutherford MA, Pennock JM and Dubowitz LMS (1994) Cranial ultrasound and magnetic resonance imaging in hypoxic–ischaemic encephalopathy: a comparison with outcome. Dev Med Child Neurol 36, 813–825.
- Rutherford MA, Pennock JM, Schwieso JE et al. (1995) Hypoxic–ischaemic encephalopathy: early magnetic resonance imaging findings and their evolution. Neuropediatrics 26, 183–191.
- Rutherford MA, Pennock JM, Schwieso JE et al. (1996) Hypoxic–ischaemic encephalopathy: early and late MRI findings and clinical outcome. Arch Dis Child 75, 141–151.
- Rutherford MA, Pennock J, Counsell S et al. (1998) Abnormal magnetic resonance signal in the internal capsule predicts poor developmental outcome in infants with hypoxic–ischaemic encephalopathy. Pediatrics 102, 323–328.
- Saint-Hilaire MH, Burke RE, Bressman SB et al. (1991) Delayed-onset dystonia due to perinatal or early childhood asphyxia. Neurology 41, 216–222.
- Sarnat HB and Sarnat MS (1976) Neonatal encephalopathy following fetal distress: a clinical and electrophysiological study. Arch Neurol 33, 696–705.
- Traill Z, Squier M and Anslow P (1998) Brain imaging in neonatal hypoglycaemia. Arch Dis Child Fetal Neonatal Ed 79, F145–147.
- van der Knaap MS, Smit LS, Nauta JP et al. (1993) Cortical laminar abnormalities: occurrence and clinical significance. Neuropediatrics 24, 143–148.
- Volpe JJ, Herscovitch P, Perlman JM et al. (1985) Positron emission tomography in the asphyxiated term newborn: parasagittal impairment of cerebral blood flow. Ann Neurol 17, 287–296.
- Yokochi K (1998) Clinical profiles of subjects with subcortical leukomalacia and border-zone infarction revealed by MR. Acta Pediatr 87, 879–883.