Cerebral infarction in the
full-term infant
Eugenio Mercuri, Lilly Dubowitz and Mary A Rutherford
Chapter Contents
- Introduction
- Arterial infarction
- Borderzone infarcts
- Neurodevelopmental outcome in arterial
- Case histories
- Summary
- References
Introduction
Neonatal cerebral infarction or stroke may be defined as ‘a severe disorganization of gray and/or white matter architecture caused by embolic, thrombotic or ischemic events’. The increase in neonatal imaging in infants with abnormal neurological signs has highlighted the wide spectrum of these lesions2, 4, 6, 8, 9, 11, 13, 16, 19, 23, 26, 29 . Infarcts may be divided into two main types: those occurring within the territory of a major artery and those occurring in the borderzone or watershed areas.
< prev | top | contents | next >
Arterial infarction
AETIOLOGY
The most commonly reported type of neonatal cerebral infarction in the full-term infant are ischemic lesions in the territory of a major cerebral artery. The middle cerebral artery is most commonly affected and, as found in adult stroke, the left middle cerebral artery is three to four times more frequently involved than the right15. Infants with involvement of the anterior or posterior cerebral artery may be asymptomatic and therefore underdiagnosed. In addition, lesions in these regions can be difficult to detect with cranial ultrasound19, 23.
Before the advent of neuroimaging, infarction was thought to be a rare condition, recognized only at postmortem examination in infants with congenital heart disease or other life-threatening conditions such as disseminated intravascular coagulation or sepsis.
Following the introduction of neonatal cranial ultrasound and CT scanning in the late 1970s, cerebral infarcts were also identified in infants who survived, most of them being associated with severe perinatal asphyxia2. Large infarcts were also observed in young children who had no obvious perinatal problems and it was thought that in these cases the infarcts must have occurred antenatally. More recently, early and serial imaging in the newborn has allowed us to recognize that infarcts are more frequent than assumed, and has also provided information about the spectrum of these lesions and their possible etiology4, 6, 8, 9, 11, 13, 16, 19, 23, 26, 29 .
The etiology of most arterial infarcts remains unclear as only a minority are associated with the clinical conditions reported in earlier studies. Severe adverse antenatal and perinatal factors are relatively rare, and whilst many of these infants have some signs of fetal distress, their Apgar scores are usually normal at 5min19. The onset of convulsions in the first days of life is usually the first clinical sign leading to diagnostic investigation. In recent years, the etiological role of hematological factors in cerebral infarction has been studied, with some reports of an increased incidence of heterozygosity for factor V Leiden. In our own cohort of 24 infants with arterial infarction, five infants were heterozygous for factor V Leiden all of whom developed a hemiplegia, compared to only one of the 19 infants without factor V Leiden24.
CLINICAL FINDINGS
Infants with focal infarction do not usually have an encephalopathy; they are alert and responsive to visual and auditory stimuli. Convulsions are often the first and only clinical sign, which will draw attention to the presence of the lesion in the first days of life. The convulsions are usually unilateral at the onset but may become generalized during the seizure. Some infants may show abnormal tone in the limbs usually contralateral but occasionally ipsilateral to the lesion7. These abnormal neonatal signs, if present, are often transient and do not predict later outcome23. In some cases abnormal clinical signs during the neonatal period are either absent or so subtle that they escape detection (Fig. 7.2). The neurodevelopmental outcome in infants with perinatal infarction is variable, ranging from normality to the presence of a hemiplegia. Early continuous EEG may demonstrate seizure activity but assessment of the background activity is most important for predicting motor outcome23, 32. Infants with or without a later hemiplegia may be at risk for non-motor impairments that become obvious in early childhood (see case histories).


Fig. 7.1 (a) Inversion recovery sequence (IR 3800/30/950). Infant aged 3 weeks. There is a small infarct involving the head of the caudate nucleus and the lentiform on the left (arrow). (b) Inversion recovery sequence (IR 3800/30/800). Infant aged 12 months. There is extensive infarction and atrophy of the left hemisphere. There is reduced high signal intensity from myelination on the left. The ventricles are dilated. (c) T1 weighted spin echo sequence (SE 860/20). Infant aged 7 days. There is abnormal signal intensity within the caudate head and lentiform on the left (long arrow). There is additional highlighting of the Sylvian cortex and low signal within the adjacent subcortical white matter (short arrow). (d) Inversion recovery sequence (IR 3800/30/950). Infant aged 9 days. There is an infarct involving the left parieto/temporal/occipital region. The involvement of the medial aspect of the occipital lobe (arrow) indicates posterior cerebral artery territory. This lesion may represent an asymmetrical watershed lesion. Careful examination of all levels of imaging to identify involvement of other watershed areas is indicated.

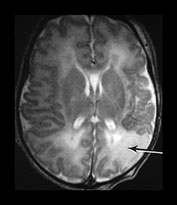

Fig. 7.2 (a),(b),(c) Fast spin echo sequence (FSE 3000/208). Infant aged 3 days. This infant was enrolled as a control patient for an imaging study. He had no presenting signs. The infarct in the territory of the MCA was picked up incidentally. There is loss of gray/white matter differentiation with abnormal high signal intensity (arrows) involving the parietal (a), occipital (b) and temporal (c) lobes. The signal intensity changes are consistent with a perinatal insult.
MRI FINDINGS
The spectrum of lesions is wide, ranging from small abnormalities in the basal ganglia (Fig. 7.1a) to very extensive ones, which involve most of the hemisphere (Fig. 7.1b). There may also be combinations of lesions within the same infant (Fig. 7.1c). The exact site of an infarct may be difficult to define. Infarcts in the posterior territory of the middle cerebral artery may be confused with infarcts arising from the posterior cerebral artery or from asymmetrical watershed lesions (see below) (Fig. 7.1d). Confusion may arise because of individual variation in the arterial distribution to the brain. In addition, as the brain grows and the infarct evolves, the site of abnormality on MRI may appear to shift, further complicating the issue (case 7.3).
The following classification for middle cerebral artery infarcts according to the branch involved has been suggested by de Vries et al.6:
- main branch
- cortical branch
- lenticulostriate branches.
Although all these lesions can occur in both preterm and full-term infants, the involvement of the main branch or of one of the cortical branches is more frequently observed in the full-term infant and lesions in the lenticulostriate branch in the preterm infant (see Chapter 8).

Fig. 7.3 Inversion recovery sequence (IR 3800/30/950). Infant aged 14 days. There is a large infarct involving the left hemisphere. There are additional abnormal high and low signal intensities within the basal ganglia and thalamus and the internal capsule on the left. The normal signal from myelin in the posterior limb of the internal capsule is only seen on the right (arrow).

Fig. 7.4 Inversion recovery sequence (IR 3800/30/950). Infant aged 6 days. There is a small area of infarction in the temporal pole on the left (arrowhead). The infarct was more extensive on superior slices. There is a small hemorrhagic lesion in the right mesencephalon (long arrow). There is subdural hemorrhage around the surface of the brain (short arrow).
Main branch/cortical branch
In the neonate these lesions are mainly ischemic without a hemorrhagic component, unlike the infarcts which occur in older children and in adults. The initial lesion is seen as a loss of gray/white matter differentiation with mainly low signal intensity on T1 and high signal intensity on T2 weighted images (Fig. 7.2)
Infarcts associated with occlusion of the main branch of the middle cerebral artery (MCA) may involve the white matter and cortex within the frontal, parietal, temporal and occipital lobes (Fig. 7.2) There may be additional involvement of the ipsilateral internal capsule and the basal ganglia/thalamus (Fig. 7.3). An infarct in the territory of a cerebral artery may also occur in association with other ischemic or hemorrhagic lesions in the ipsilateral or contralateral hemisphere (Fig. 7.4). The main infarction can be associated with a contralateral infarction (case 7.7), with more discrete ischemic lesions (Fig. 7.5) or punctate hemorrhagic lesions (Fig. 7.6) in the white matter. Infants with bilateral MCA territory lesions may develop the perisylvian syndrome (case 7.7).
The site and extent of the changes relating to occlusion of a cortical branch is quite variable. In our recent series of 20 infants with cortical branch infarcts, only four infants had additional lesions within the basal ganglia/thalamus and the internal capsule23.
Using serial imaging it is possible to observe the evolution of infarcted areas over the first few weeks and months of life.

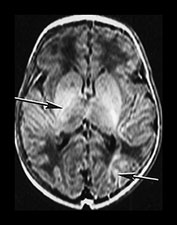

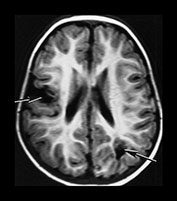
Fig. 7.5 Inversion recovery sequence (IR 3800/30/ 950). (a, b) Infant aged 6 days. There is abnormal high signal intensity within the cortex of the right Sylvian fissure. (a) (arrow) There is an asymmetry of the signal intensity from myelin in the posterior limb of the internal capsule with decreased signal intensity on the right (long arrow). There is an additional abnormal low signal intensity within the right thalamus and lentiform nucleus. There is an additional area of abnormal high signal intensity within the left occipital lobe (b) (arrow). T2 weighted sequence (SE 3000/120). Same infant aged 6 days. (c) The abnormalities within the cortex are seen as low signal intensity and are more obvious. The abnormalities within the lentiform and thalamus are seen as high signal intensity. The posterior limb of the internal capsule has abnormally high signal intensity throughout (arrow). Inversion recovery sequence (IR 3400/30/800) (d) at 20 months of age. There are two discrete areas of infarction (arrows) and mild dilation of the ventricles.
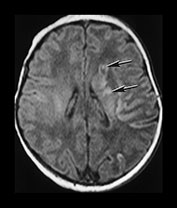

Fig. 7.6 T1 weighted spin echo sequence (SE860/20). (a), (b) Infant aged 7 days (as in Fig. 7.1c). There are small high signal intensity hemorrhagic lesions in the white matter and basal ganglia (arrows).
Evolution first week
Changes during the first few days of life may be difficult to identify with conventional imaging alone (Fig. 7.7). Conventional imaging during the first week will show a loss of gray/white matter differentiation with a generally low signal intensity in the region of the infarct on T1 weighted images. On T2 weighted images there is a loss of differentiation and generally increased signal intensity (Fig. 7.8). Changes are usually easier to identify on T2 weighted scans (Fig. 7.8). Diffusion weighted imaging during the first week ‘highlights’ infarcted areas and this then aids detection on the conventional images (Fig. 7.7 and Fig. 7.8). The abnormalities on diffusion weighted imaging become less obvious by the end of the first week by which time the abnormalities are more obvious on the conventional T1 and T2 weighted images (Fig. 7.8). Animal studies have reported that changes on diffusion are more evident a few hours after an acute ischemic insult and tend to be less evident a few days after, thus the sequence of findings in infants with infarcts suggest that the acute event occurred around the perinatal period5.
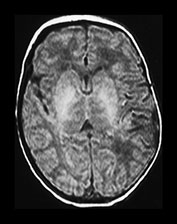
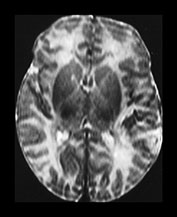
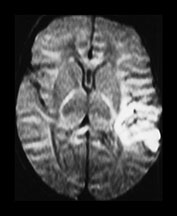
Fig. 7.7 Left-sided MCA infarct. Infant aged 4 days. T1 weighted spin echo (SE 860/20) (a), T2 weighted spin echo sequence (b), and diffusion weighted image (c) anterio-posterior sensitization. The abnormalities on conventional imaging are subtle. The diffusion changes consistent with restriction of water.


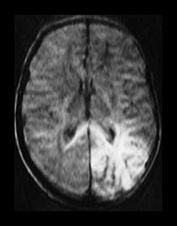


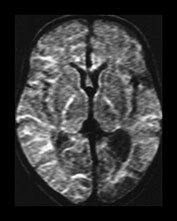
Fig. 7.8 (a) T1 weighted sequence (SE 860/20). (b) T2 weighted sequence (SE 2700/120). Left-sided infarct, probably in the territory of the posterior cerebral artery (arrows). (c) Diffusion weighted imaging. Infant aged 4 days. The abnormalities are more striking on the diffusion weighted images. (d) T1 weighted sequence (SE 860/20). (e) T2 weighted sequence (SE 2700/120). (f) Diffusion weighted imaging. Same infant aged 9 days. The abnormalities are more obvious on the conventional spin echo sequence images. The diffusion abnormalities are no longer evident.
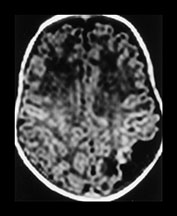

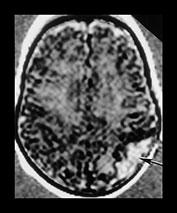
Fig. 7.9 T1 weighted volume acquisition images taken at 4 weeks (a) and 3 months (b). There is a region of infarction in the left posterior parietal lobe, which has decreased in size. After registering (a) and (b) there is high signal intensity consistent with new brain growth (arrow) within the original infarcted area (c).

Fig. 7.10 Inversion recovery sequence (IR 3800/30/950). Infant aged 12 months. Left MCA infarction with involvement of the anterior temporal lobe (arrowhead). There is asymmetry of the mesencephalon with atrophy consistent with Wallerian degeneration on the left (arrow).

Fig. 7.11 Inversion recovery sequence (IR 3800/30/950). Infant aged 2 weeks. There is obvious asymmetry of the brain stem, with atrophy of the left in this infant who presented with seizures on day 2. The infarct seen in the left anterior lobe (arrow) looks about 1–2 weeks old. The brain stem asymmetry may originate from a previous lesion that is no longer identifiable.

Fig. 7.12 Inversion recovery sequence (IR 3800/30/950). Infant aged 6 days. There is a hemorrhagic infarct in the left caudate head (arrow).

Fig. 7.13 Inversion recovery sequence (IR 3800/30/950). Term infant presenting with seizures following delivery on to the floor at home. Imaged at 5 days. There is bilateral loss of gray/white matter differentiation in the posterior parietal and temporal lobes. The basal ganglia are normal and the internal capsule is appropriately myelinated. This infant became microcephalic, has mild developmental delay but a normal motor outcome.
Evolution second to sixth week
During the second week following an infarction there may be an exaggeration of gray/white matter differentiation with areas of cortex becoming highlighted and white matter becoming even lower signal intensity using T1 weighted imaging (Fig. 7.8). From 2 weeks onwards there may be breakdown of infarcted tissue. The extracerebral space may widen. A porencephalic cyst may form although there is usually some tissue visible within it, especially if windowed appropriately prior to image processing (case 7.1). On T1 weighted sequences high signal areas may appear around the penumbra of the infarct. The histological correlation for this lesion is not clear but it may represent capillary proliferation or possibly the presence of lipid-laden macrophages.
Evolution 6 weeks to 1 year
Over the next few months as the brain grows the infarct may appear to decrease in size and in some infants the original lesion may be difficult to identify (case 7.3). The affected hemisphere, however, usually looks smaller than the non-affected one and shows a generalized decrease in myelination most obvious around the site of the infarct. This clearly relates to the original size of the lesion and its evolution. Using a specifically designed computer program we have been able to accurately match and subtract serially acquired volume acquisition images in infants with focal infarcts27. Using this technique we have been able to identify the early changes in signal intensity and tissue breakdown. Matching and then subtracting the serially acquired images has then shown us that there may be excessive growth in and around the infarct over the next few months (Fig. 7.9). These changes are not detectable on visual analysis of the conventional images. This excessive growth may lead to the virtual disappearance of smaller infarcts. Regions of unexpected excessive growth may correspond to previously unrecognized regions of white matter damage (Fig. 7.15). Conventional imaging shows that regions of excessive growth appear to have normal imaging characteristics and that in general infants with focal infarction have relatively small amounts of glial tissue on later imaging. The period of excess growth seems to start around 6 weeks and end by approximately 1 year of age.
Wallerian degeneration
In the acute stages of MCA infarction there may be abnormal signal intensity within the brain stem, presumably resulting from the phenomenon of diaschisis (case 7.7). Diaschisis is the term applied to acute metabolic changes that occur in connected but distant areas of the brain in response to a focal injury. This has been traditionally used to describe changes in the cerebellum following infarction of the forebrain.
In both perinatal main and cortical branch infarction changes in the size of brain stem due to secondary atrophy, Wallerian degeneration, become evident after 6–8 weeks and may become progressively more obvious (Fig. 7.10). Infants that show earlier asymmetry may have had an antenatal insult in addition to their perinatal infarct (Fig. 7.11). Early serial imaging may help to distinguish separate insults (case 7.1). Secondary degeneration may also give rise to atrophy of the ipsilateral thalamus, in the absence of initial involvement. Both ipsilateral and contralateral cerebellar atrophy have been demonstrated following focal infarction. This is thought to arise from the phenomenon of diaschisis. However, in a series of 10 term infants with perinatal focal infarction we have shown that cerebellar hemisphere growth was symmetrical and comparable to controls over the first year of life14.
Lenticulostriate branch
These lesions are more frequently observed in preterm infants6 but can occasionally be seen in full-term infants (see Chapter 8). Unlike infarcts in the territory of cortical branches, they often have a hemorrhagic component. The lesions generally involve the lentiform and, sometimes, the caudate and/or the thalamus and the internal capsule (Fig. 7.12). Infants may also show a combination of cortical branch and basal ganglia lesions (Fig. 7.3). Small cystic lesions within the basal ganglia found incidentally on imaging are likely to represent small old infarcts (case 7.1).
< prev | top | contents | next >
Borderzone infarcts
ETIOLOGY
Perinatally acquired infarcts may also occur not in the distribution of one main artery but in the borderzone or watershed regions between arterial territories, so-called parasagittal lesions31. These lesions which, so far, have only been described in full-term infants, are thought to be due to an acute decrease in cerebral blood flow31. The affected areas will therefore be those that are most susceptible to hypotension and a fall in perfusion, such as the regions in the posterior lobes which represent the end fields among all the three main cerebral arteries.
Adverse antenatal factors are not frequent but in our experience these lesions, unlike the arterial infarcts, are usually associated with perinatal distress and/or mild signs of hypoxic–ischemic encephalopathy. These infants may show CTG abnormalities, meconium-staining liquor and instrumental deliveries are frequent. They may require some respiratory assistance such as facial O2 or bagging but not intubation. The Apgar scores are often low at 1min but recover quickly within 5 or 10min (case 7.5). This pattern of injury may also be seen in infants with hypoglycemia1.
CLINICAL FINDINGS
Infants with parasagittal lesions may develop seizures in the first 48h although this may not be the first presenting sign. On neurological examination these infants are hypotonic; this is partly due to the fact that they are often assessed after the onset of seizures and the administration of anticonvulsants. The neonatal EEG may be normal, show epileptic discharges but a normal background or, in some cases, show a discontinuous background activity23.
MRI FINDINGS
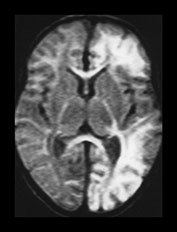
Fig. 7.14 Asymmetrical borderzone infarction. Diffusion weighted image, infant aged 6 days, showing abnormal restriction giving high signal intensity in the left frontal, parietal, temporal and occipital lobes. There is no obvious involvement of the right hemisphere at this level.
The lesions are generally bilateral, involving the posterior convexity (Fig. 7.13, case 7.5)and, in some cases, the anterior lobes. These lesions are quite symmetrical but in some, the lesion can be more predominant on one side, involving the anterior and posterior lobes and giving only a minimal involvement of the contralateral hemisphere (Fig. 7.14). The lesions are ischemic and seen as low signal intensity on T1 and high signal intensity on T2, but may have hemorrhagic components. The evolution of these lesions is similar to that observed in more focal cerebral infarcts with similar changes of excessive growth demonstrable on serial registration (Fig. 7.15). Occasionally, areas of infarction are seen adjacent to subdural hemorrhage (case 7.6). The exact association between these two lesions is unclear. It is possible that the subdural hemorrhage interferes with venous drainage resulting in venous infarction of the adjacent parenchyma. It has also been suggested that the infarction results from arterial spasm.


Fig. 7.15 Registration and subtraction of images. T1 weighted volume acquisition. (a) Aged 2 months, note the highlighting around the edge of the infarcted tissue on the left (arrowhead). There is an additional small area of infarction on the right (arrow). (b) Aged 6 months. There is atrophy and decreased myelin throughout the left hemisphere. (c) Subtraction image. There is high signal intensity around the atrophied left hemisphere consistent with new brain growth (arrow). There is high signal intensity along the medial aspect of the right occipital lobe with a resultant decreased width of the interhemispheric fissure. This may represent an area of previously unrecognized white matter injury.
< prev | top | contents | next >
Neurodevelopmental outcome in arterial and borderzone infarcts: prognostic factors
MOTOR OUTCOME
Until a few years ago most of the studies on neonatal infarcts, with a few exceptions, reported a very high incidence of abnormal motor outcome, mainly hemiplegia3, 10, 12, 13, 16–18, 25, 28, 30, 33Because of these early studies, parents of infants with cerebral infarction have been counselled about the high risk of their children developing cerebral palsy. With the increase in the detection of infarcts in infants without birth asphyxia, however, it has become evident that the incidence of abnormal motor outcome is lower than assumed8, 23.
We have reviewed a series of 24 children all of whom had early neonatal MRI23. The infants were followed longitudinally for at least 2 years in order to establish the best prognostic indicators in the neonatal period. Hemiplegia was present in only 20% of the children investigated. The presence of adverse antenatal and perinatal factors was not significantly associated with abnormal outcome.
We were unable to find any significant association between the neonatal neurological examination and outcome as abnormal signs in the neonatal period were found in infants with and without a normal outcome.
Neonatal MRI findings were better predictors of outcome. The presence of hemiplegia, however, did not seem to relate to the type of infarction, as the incidence was similar in both arterial and borderzone infarcts. In contrast, the extent of the lesion, and in particular the concomitant involvement of hemisphere, basal ganglia and internal capsule, was significantly associated with outcome. While infants who had involvement of one or two of these three components tended to have a normal motor outcome, infants with involvement of all three sites, developed an abnormal motor outcome (cases 7.4 and 7.7).
We have also shown that neonatal EEG can be equally predictive of late outcome. While all the infants who had normal background activity had a normal motor outcome23, irrespective of the presence or absence of epileptic discharges, all the infants with abnormal background activity, unilateral or bilateral, developed hemiplegia.
Our recent studies24 on the association between perinatal infarction and thrombotic disorders have shown a strong association between factor V Leiden and the development of hemiplegia. Further studies are warranted to look at this relationship in more detail and to investigate the potential role of other prothrombotic factors such as the G20210A mutation in the prothrombin gene and the C677T mutation in the methylenetetrahydrofolate reductase gene.
VISUAL OUTCOME
The association between cerebral infarction and visual abnormalities has been well documented in children and adults suffering from stroke20, 34. In these cases there appears to be a good correlation between the severity of MRI abnormalities and the severity of visual impairment. Lesions affecting the striate occipital cortex and the optic radiations are generally associated with contralateral hemianopia and lesions affecting the parietal lobe with abnormal visual attention and, in the most severe cases, with contralateral visual neglect.
Using a battery of tests, which were specifically designed to evaluate visual function in the first year of life, we have been able to demonstrate that infants with infarction have normal acuity and ocular movements but may show narrower visual fields and abnormal visual attention, as tested by fixation shift21, 22. It is of interest, however, that in contrast to adults, not all the children who had involvement of the structures of the visual pathway on MRI developed abnormal visual function. Only 50% of the infants with involvement of the optic radiation had abnormal fields and only 50% of the infants with parietal lobe lesions had an abnormal fixation shift in the first year of life. These findings suggest that the immature brain can to some extent compensate for early lesions affecting the visual pathway.
NEUROCOGNITIVE OUTCOME
The plasticity of the neonatal brain may allow normal motor function in the presence of large areas of infarction; however, this may cause a ‘crowding out’ effect and occur at the expense of neurocognitive functions that develop later in childhood (see case histories). Long-term prospective follow-up studies to assess language, behaviour and neurocognitive functions in infants with and without a motor impairment will further define the extent and quality of compensation following perinatal infarction.
< prev | top | contents | next >
Case histories
CASE 7.1
This male infant was born at 39 weeks’ gestation (birth weight 3.132 kg).
Antenatal
His mother was a caucasian primigravida with known endometriosis. She was admitted to hospital at 34 weeks with abdominal pain, which settled spontaneously. Fetal movement and heart rate monitoring were satisfactory.
Labor and delivery
The onset of labor was spontaneous at 39.6 weeks. Five hours before delivery there were variable decelerations to 70 beats/min on the cardiotocogram (CTG) for which she was given facial oxygen. Three hours before delivery, grade 1 meconium was noted, a fetal blood sample at that time showed a pH of 7.32. The variable decelerations continued and a cesarian section was performed for failure to progress and fetal distress. The cord pH was 7.15. Apgar scores were 9 at 1min and 10 at 5min but thick meconium was present. Suction revealed that this was all above the cords.
• Neurodevelopmental outcome is not always predictable.
Maternal pathology
At the time of the cesarian section lesions were noted in both ovaries with adhesions to the parametrium. On microscopy, these were shown to contain hemorrhagic decidua with thrombotic vessels. Coagulation and thrombophilic screening were normal.
Postnatal course
The infant was transferred to the postnatal ward but became jittery at 24h, which was more marked on the left. Episodes of desaturations were noted at 36h and an EEG confirmed neonatal convulsions. The EEG on day 3 showed continuous background activity with seizure activity mainly on the right.
Neurological evaluation
Neonatal neurological examination on day 3 showed asymmetrical limb tone fisting and nystagmus. On day 9 the asymmetrical limb tone persisted; his head control and visual alertness were poor. At 1 month he still had poor head control and asymmetrical arm tone. At 3 months there was no asymmetry of tone but he tended to first with both hands more so on the right. At 9 months he had a tight right popliteal angle but no other asymmetries were present. At 4 years he had mild general hypotonia with very mildly increased tone in the lower limb on the right the ipsilateral side of the main infarct. He had a strong preference for his left hand and although he had a pincer grasp on the right, this was cruder than on the left. On Griffiths developmental scales he scored at a 4-year level on all subscales except for performance where he performed at a 3-year 8-month level. He has had no further convulsions. Visual function is normal.
Thrombotic screen
Coagulation and thrombophilic screening was normal.
Comment
This infant had a substantial infarct on the right, yet developed a right-sided hemiplegia, presumably related to the very small lesion seen in the left hemisphere and associated with abnormalities in the left internal capsule.


Fig. 7.16A Early imaging, Cranial ultrasound showed a right-sided echo density and a small left-sided hemorrhagic lesion on day 5. Inversion recovery sequence (IR 3800/30/950) (a) at 5 days of age shows a large area with loss of gray/white matter differentiation on the right (arrowhead) and a small cyst on the lateral edge of the right lentiform nucleus (arrow). The areas of abnormality are well shown on the diffusion weighted imaging in the coronal plane. There is some additional increased signal intensity on the left. (b). Early angiography (day 5) shows poor filling in the MCA on the right (arrow) (c). This has improved 1 week later (day 11) (arrow) (d).
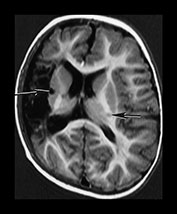

Fig. 7.16B Late imaging. Inversion recovery sequence (IR 3400/30/800). (e) Aged 1 year. There is a large infarct on the right. The separate cystic lesion is seen on the lateral border of the lentiform nucleus (long arrow). There is abnormal signal intensity within the internal capsule on left (short arrow) FLAIR (IR 6500/160/600) sequence. (f) Abnormal signal intensity within the internal capsule is seen as high signal intensity (long arrow). This may be related to the left-sided lesion seen on early diffusion images. Strands of tissue within the infarct are more easily visible (short arrow).
CASE 7.2
This female infant was born at 40 weeks’ gestation (birth weight 3.956g).
Antenatal
Her mother was a caucasian primigravida. There were no adverse antenatal factors and she went into spontaneous labor.
Labor and delivery
A baseline fetal tachycardia of 160–170 beats/min and early decelerations to 80 beats/min were noted 5h before delivery, the fetal scalp pH was 7.31. There was a delay in second stage, maternal pyrexia and further fetal bradycardia and so she was delivered by Simpson’s Forceps, which required three pulls. Apgar scores were 8 at 1min and 10 at 5min.
• Good motor outcome with frontal lesions.
Postnatal course
The infant went to the postnatal ward with her mother. An infection screen was negative. She remained well until the second day when she developed left-sided twitching in her arm and leg. An EEG showed spikes and sharp waves before phenobarbital was given but subsequently normalized.
Early imaging
Cranial ultrasound showed increased echogenicity in the region of the right Sylvian fissure on day 3. MRI at 10 days showed an infarct in the right frontal lobe.
Neurological evaluation
Neonatal neurological examination on day 9 showed mildly asymmetrical limb tone and some truncal hypotonia. At 8 weeks of age she still had mildly reduced tone but no asymmetries. At 3 months some fisting and a tighter popliteal angle was noted on the ipsilateral side of the lesion but by 6 months she was completely normal. At 3 years 6 months she was neurologically completely normal but had a very strong right-hand preference. Her Griffiths subscales ranged from 3y 6m–4y 4m with the lowest score in language and the highest in the performance scale. At 5y 6m she had a normal neurological examination. A normal Movement ABC. Her scores on the WIPPS were 100 for performance and 85 for language. Her visual function was also normal. She has had no further convulsions.
Thrombotic screen
Coagulation and thrombophilic screening was normal.
Comment
Mild asymmetries during the first few months of life are not predictive of motor outcome. Her borderline language abilities at 5.5 years suggest other developmental abilities may be impaired.

Fig. 7.17A Early imaging. Inversion recovery sequence (IR 3800/30/950). Infant aged 10 days. There is a region of low signal intensity within the right frontal white matter (arrow). There is associated highlighting of the cortex. The signal intensity from myelin within the posterior limb of the internal capsule is symmetrical and normal.
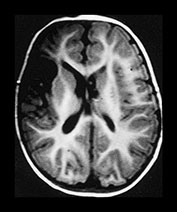
Fig. 7.17B Late imaging. Inversion recovery sequence (IR 3600/30/800) at 10 months of age shows an infarct in the right frontal lobe.
CASE 7.3
This male infant was born at 40 weeks’ gestation (birth weight 2.8kg).
Antenatal
His mother was an Indian primigravida. Her antepartum course was uneventful.
Labor and delivery
`There was a spontaneous onset of labour which progressed well until 2h before delivery when a fetal tachycardia (165–170 beats/min) with some loss of variability were observed. These persisted for 1h and then fetal decelerations with slow recovery were noted. One hour later an emergency cesarian section was performed for failure to progress and fetal distress. Apgar scores were 9 at 1min and 10 at 10min.
Postnatal course
The infant was sent to the postnatal ward with the mother where he remained well until 14h of age when he developed marked twitching in the right arm and leg which became generalized 2h later. Cranial ultrasound was normal at 24h but on day 4 showed increased echogenicity in the region of the left Sylvian fissure.
Neurological evaluation
Neonatal neurological examination at 14h revealed a jittery infant with normal tone, good fixation and no other abnormal movements. On day 6 he had mildly asymmetrical arm tone but was otherwise normal. When seen at 4 weeks he had completely normal tone but was visually inattentive. The child remained completely normal with symmetrical postures, tone and movement. At 4 years 6 months he has equal fine manipulation in both hands, his subscores on the Griffiths scale range from 4 to 5 years with the lowest score on the performance scale. He has had no further convulsions. His visual function is normal.
• Perinatally acquired infarcts may be difficult to identify later in childhood.
Thrombotic screen
He showed an increased factor VIII.
Comment
Perinatally acquired MCA infarcts may evolve to resemble clefts that could be wrongly classified as congenital in origin.
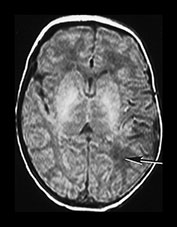


Fig. 7.18A Early imaging. Conventional MRI at 2 days shows only minimal low signal intensity within the posterior parietal white matter on T1 weighted images (a) (arrow) and minimal high signal on T2 weighted images (b) (arrow). There is no obvious loss of gray/white matter differentiation. On the diffusion weighted image there is obvious abnormal high signal intensity, more anteriorly (c). The appearances of the internal capsule are normal on all images.
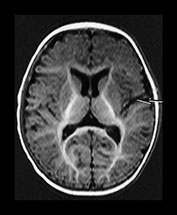
Fig. 7.18B Late imaging. (d) Inversion recovery sequence (IR 3400/30/800) at 6 months of age shows only a small closed ‘cleft’ (arrow) in the region of the infarct as seen on diffusion weighted imaging.
CASE 7.4
This male infant was born at 39 weeks’ gestation (birth weight 3.58 kg).
Antenatal
His mother was a caucasian primigravida mother who had two previous first trimester abortions. She also had ulcerative colitis and was treated with steroids throughout the pregnancy.
Labor and delivery
She was induced at 39 weeks’ gestation for raised blood pressure. Labor was reported as normal. The Apgar score was 7 at 1min, the infant being limp and dusky but he picked up rapidly on facial O2 and the Apgar was 10 at 5min. The cord pH was 7.07.
Postnatal course
The infant was transferred to the postnatal ward with the mother and remained well until 24h of age when he was noted to feed poorly and had three episodes of stiffening which were interpreted as convulsions. An EEG on day 6 showed an asymmetrical background with sharp waves and spikes on the left but no seizure activity.
Early imaging
Cranial ultrasound showed an area of increased echogenicity in the area of the Sylvian fissure on day 4.
• Early MRI, EEG and the presence of factor V Leiden may all independently predict later hemiplegia.
Neurological evaluation
Neurological examination on day 5 showed some asymmetry of tone and poor head control. The hypotonia was still present on day 19 but there was no asymmetry. At 7 weeks of age he was still mildly hypotonic, had intermittent fisting but had no asymmetries. At 6 months he had dystonic posturing of the right arm and increased tone in the right shoulder girdle. At 9 months, in addition to the previous findings, he started to show a marked hand preference and had asymmetry in his popliteal angle but had symmetrical vertical kicking. At 16 months the dystonic arm posturing was more marked, he had a tighter shoulder girdle but no limitation of pronation and supination on the right. He had a left-hand preference with a better grasp on the left, but his gait was normal. At 4 years he shows signs of a mild right hemiplegia. He has asymmetry of upper limb with abnormal tone in the shoulder girdle and limitation of pronation and supination but he has some independent finger movement and is able to put coins in a moneybox. The lower limb is also only mildly affected with some asymmetry of tone but no functional impairment. His Griffiths subscales range from 3 years on the perceptual scale to 4 years 4 months on practical reasoning. He has had no further convulsions. He shows a mild asymmetry in visual fields with the right narrower than the left.
Thrombotic screen
This infant was heterozygous for factor V Leiden.
Comment
This child’s hemiplegia could have been predicted from his early EEG with asymmetrical background activity, the initial pattern of injury on MR and possibly from his factor V Leiden heterozygosity. He has obvious perceptual problems in addition to his hemiplegia.
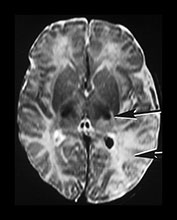
Fig. 7.19A Early imaging. T2 weighted sequence (SE 2700/120) imaging on day 4 showed a loss of gray/white matter differentiation in the left temporo-parietal region (arrowhead). The signal from myelin in the posterior limb of the internal capsule is asymmeterical. There is a small area of abnormal increased signal intensity in the thalamus extending into the posterior part of the posterior limb of the internal capsule (arrow). There is low signal intensity within the choroid plexus of the posterior horn of the left lateral ventricle, consistent with hemorrhage.

Fig. 7.19B Late imaging. Inversion recovery sequence (IR 3000/30/860) at 6 months of age shows atrophy of the left hemisphere. There is a small interruption in the myelin in the posterior limb of the internal capsule on the left (arrow).
CASE 7.5
This female infant was born at 41 weeks’ gestation (birth weight 2.94 kg).
Antenatal
This was the third pregnancy of a caucasian woman with a previous history of infertility. She had one first trimester abortion and one living child with congenital heart defects. This pregnancy was uneventful until 3 days before delivery when she presented with severe abdominal pain. There was no bleeding and there was no evidence that she was in labor on vaginal examination. The CTG was normal. Three days later she was admitted in labor.
Labor and delivery
Late deceleration with loss of variability were noted, a fetal blood sample showed a pH of 7.1 and an emergency cesarian section was planned. This, however, was delayed by a further 2h as there was difficulty in getting an epidural sited. At delivery, meconium grade 2–3 was present. The Apgar score was 5 at 1min, the infant was treated with suction and facial oxygen, and the Apgar score was 9 at 5min.
Postnatal course
At 2h apneas and staring episodes were noted but no abnormal movements were recorded. The EEG showed abnormal background activity and continuous seizure activity with different seizure patterns occurring simultaneously in both hemispheres. Cranial ultrasound on day 1 showed bilateral echogenicities, which were more marked on the right. These were less marked on day 2.
• Infants with borderzone parasagittal injury may present with more of an encephalopathy.

Fig. 7.20A Early imaging. (a) Diffusion weighted imaging at a high ventricular level on day 4 shows abnormal high signal intensity in the parietal lobes bilaterally consistent with parasagittal borderzone infarction.
Neurological examination
Neonatal neurological examination on day 2 showed an infant with poor alertness, abnormal eye movements, hypotonia but no asymmetry. On day 4 she had adducted thumbs but normal tone and normal alertness. At 6 weeks she was generally hypotonic, had abnormal finger postures but had good visual alertness. At 3 months slight asymmetry of tone was noted but otherwise she appeared normal. At 10 months she had intermittent fisting of the right hand with a strong left-hand preference and mild asymmetry of lower limb tone. Her Griffiths subscores were between 10.5 and 11.5 months. The findings at 2 years were similar but this time some difference in hand function was also noted. However, at 3 years although she had marked left-hand preference the fine manipulative function of her right hand was excellent. The asymmetries in the upper and lower limb tone persisted. Although she had a tendency to tiptoe she was able to walk with a heel-toe gait and actively dorsiflex her foot. On the Griffiths scale her performance varied from 2.8 months to 3.6 months. Her poorest scale was her eye/hand co-ordination because of her very poor drawing ability. Although she coped well with puzzles she showed some other perceptual difficulties. Her visual function is normal. She has had no further convulsions.
Thrombotic status
Factor V Leiden was not measured in this child but was normal in both parents. She also has an increased factor VIII.


Fig. 7.20B Late imaging. (b) Inversion recovery sequence (IR 3600/30/900) image at a low ventricular level at 3 months. There is normal signal intensity from myelin in both posterior limbs of the internal capsule. Myelination is slightly delayed, as there is no myelin in the anterior limb. There is a porencephalic cyst in the left parietal lobe. (c) FLAIR sequence (IR 6500/160/600) at 20 months. There is no longer a porencephalic cyst. There is marked atrophy of the left parietal lobe with some increased signal intensity consistent with glial tissue. Both occipital poles appear atrophied. There is a small amount of increased T2 in the posterior periventricular white matter on the right.
CASE 7.6
This male infant was born at 39 weeks’ gestation (birth weight 3.35 kg).
Antenatal
His mother was a caucasian primigravida. The pregnancy was uneventful until the day before delivery when she had rather severe abdominal pain.
Labor and delivery
She went into spontaneous labor. There were some CTG decelerations with quick recovery 6h before delivery, but after that the quality of the fetal monitoring was poor. The infant was delivered by spontaneous vaginal delivery. The Apgar score was 3 at 1min. The infant picked up quickly with suction and facial O2. The cord pH was 7.06
Postnatal course
The infant went to the postnatal ward with the mother and was apparently well till a few hours later when he was noted to be ‘floppy and sleepy’ and the blood glucose stick was reported as 1.4. On day 2 he was still very floppy but the blood glucose stick was now in the normal range. He would not suck on the breast but took a bottle well. He was noted to be more floppy on the right and a jittery episode lasting 15s was reported. EEG and CFM showed discontinuous background activity with epileptic discharges. Cranial ultrasound on day 2 showed increased echogenicity on the left compatible with infarction.
• Arterial infarction may be associated with additional hemorrhagic lesions.
Neurological evaluation
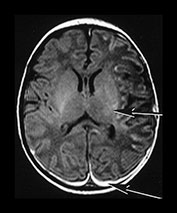
Fig. 7.21A Early imaging. T1 weighted spin echo sequence (SE 860/20) on day 6 showed multiple areas of cortical highlighting in the left hemisphere with abnormal low signal intensity in the adjacent white matter. There was subdural hemorrhage (long arrow) and a hemorrhagic lesion in the right brain stem (Fig. 7.4). The signal intensity within the posterior limb of the internal capsule is asymmetrical, being abnormal on the left (short arrow). There is a small area of abnormal high signal intensity in the posterior part of the lentiform nucleus adjacent to the posterior limb on the left.
Neonatal neurological examination on day 3 revealed an extended posture, diminished axial and limb tone but no asymmetries. On day 8 the posture was normal, tone was still diminished and was now asymmetrical with reduced tone on the left. At 7 weeks he followed better to the left, still had some hypotonia but no other asymmetries. At 3 months his tone was symmetrical, he had better isolated movements on the right side, but better sensation on the left. At 7.5 months the movements in his arms were symmetrical; however, he kicked better with his left leg. Tone in the right arm was increased, there was a tendency to tiptoe on the right and the popliteal angle was also tighter on that side. At 2 years of age his gross and fine motor function was age appropriate, but he had some asymmetry of tone in the upper and lower limb. His hand function was also considerably poorer in the right hand although he had some independent finger movement. His Griffiths subscores were between 22 and 22.5 months. His visual function was normal. He has had no further convulsions.
Thrombotic screen
This infant was factor V Leiden heterozygous, as was his father.
Comment
The presence of heterozygous factor V Leiden is associated with an abnormal neuromotor outcome. There is also some association with the presence of additional hemorrhagic lesions.
CASE 7.7
This male infant was born at 39 weeks’ gestation (birth weight 3.049 kg).
Antenatal
His mother was a caucasian primigravida. Her pregnancy was uneventful till 36 weeks’ gestation when she was admitted to hospital with severe abdominal pain. There was no evidence of any bleeding and all investigation regarding the cause of these symptoms were negative, however, a tachycardia of 160 beats/min was recorded several times on the CTG while she was an in-patient.
• Bilateral middle cerebral artery infarction.


Fig. 7.22A Early imaging. Inversion recovery sequence (IR 3800/30/950) at a high ventricular level on day 6 showed loss of gray/white matter differentiation throughout most of the left hemisphere and in the parietal lobe on the right (arrow) (a). T2 weighted sequence (SE 2700/120) imaging through the mesencephalon shows abnormal increased signal intensity (arrow) consistent with acute degeneration or diaschisis (b).
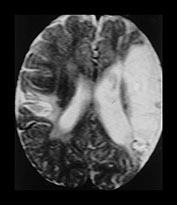
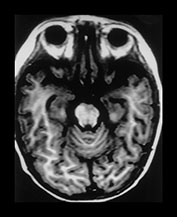
Fig. 7.22B Late imaging. T2 weighted (SE 2700/120) image (c) at 12 months shows bilateral areas infarction involving the perisylvian cortex. This is more marked on the left than the right. Inversion recovery (IR 3400/30/800). (d) There is asymmetry of the brain stem with atrophy on the left.
Labor and delivery
The onset of labor was spontaneous. Four hours before delivery decelerations to 90 beats/ min and lasting for 45s were recorded but the fetal scalp pH was 7.3. One hour before delivery persistent decelerations to 70 beats/min were recorded. The fetal blood sample was 7.2. The infant was delivered by easy forceps delivery following manual rotation. Meconium grade 2 was noted at delivery. The Apgar scores were 9 at 1min and 10 at 5min.
Postnatal course
The infant went with the mother to the postnatal ward. At 8h he had some dusky episodes and was transferred to the NICU. During the next few hours further apneic attacks were noted some of which were accompanied by jerky movements of his arms and legs. These were confirmed as convulsions by EEG. EEG showed bilateral but asymmetrical abnormal background activity.
Neurological evaluation
Neurological examination on day 8 showed he had generally decreased tone but no asymmetries. He had good auditory and visual orientation. At 6 weeks he still had no asymmetry but he had generally increased tone in both arms. When seen at 3 months his movements and tone were symmetrical but at 7 months he was noted to keep his right arm in a dystonic posture with intermittent fisting of the hand. He had a marked left-hand preference while sitting, but when lying in the prone he used both hands equally. When held in vertical suspension his kick was very asymmetrical. During the next 18 months his hemiplegia became more pronounced with further increase in tone both in his upper and lower limb. In spite of his deterioration in hand function he made good use of his right hand in bimanual manipulative tasks. He walked with a hyperextended knee but had no circumduction and at times even managed a heel-toe gait. His main problem became his poor articulation and excessive drooling but he did not appear to have major cognitive difficulties. At 4 years 6 months he was a bright little boy with a moderate hemiplegia, who in spite of his difficulties was able to participate in various sport activities including tennis and skiing. His visual function was normal. He has had no further convulsions.
Thrombotic status
Coagulation profiles of the parents were normal but they have not been tested for factor V Leiden.
Comment
This child’s marked problems with articulation and swallowing are consistent with a perisylvian syndrome. Infants with perinatally acquired bilateral MCA infarction can present with the perisylvian syndrome.
< prev | top | contents | next >
Summary
IMAGING
- Arterial infarcts can be clinically silent.
- Infants with convulsions need to be imaged even if they have normal Apgar scores and no other clinical signs.
- Early first week cranial ultrasound may be normal in infants with focal infarction.
- Perform MRI at the end of the first week of life for most information about the site and extent of infarction.
- Diffusion weighted imaging can help to identify the lesions in the first days of life.
- Excessive growth occurs in and around infarcts from 6 weeks postinfarction.
- Some infarcts may be difficult to detect later in the first year.
PROGNOSIS
- The prognosis of infants with cerebral infarction can be determined by the extent of the lesions on MRI. The concomitant involvement of hemisphere, internal capsule and basal ganglia is likely to be associated with abnormal motor outcome.
- EEG can also be a useful prognostic indicator. An abnormal background activity is likely to be associated with abnormal motor outcome.
- Perinatal infarction may be associated with an abnormal prothrombotic state. Factor V Leiden is associated with the later development of hemiplegia in infants with perinatal infarction.
- Infants with focal infarction may show subtle neurodevelopmental deficits later in childhood despite a normal gross motor outcome.
< prev | top | contents | next >
References
- Barkovich AJ, Ali FA, Rowley HA et al. (1998) Imaging patterns of neonatal hypoglycemia. Am J Neuroradiol 19, 523–528.
- Barmada MA, Moossy AJ and Shuman RM (1979) Cerebral infarcts with arterial occlusion in neonates. Ann Neurol 6, 495–502.
- Bouza H, Dubowitz LMS, Rutherford M et al. (1994) Prediction of outcome in children with congenital hemiplegia: a magnetic resonance imaging study. Neuropediatrics 25, 60–66.
- Clancy R, Malin S, Laraque D et al. (1985) Focal motor seizures heralding stroke in full term neonates. AJDC 139, 601–606.
- Cowan FM, Pennock JM, Hanrahan JD et al. (1994) Early detection of cerebral infarction and hypoxic ischemic encephalopathy in neonates using diffusion-weighted magnetic resonance imaging. Neuropediatrics 25, 172–175.
- De Vries L, Groenendal F, Eken P et al. (1997) Infarcts in the vascular distribution of the middle cerebral artery in preterm and fullterm infants. Neuropediatrics 28, 88–96.
- Dubowitz L, Dubowitz V and Mercuri E (1999) The Neurological Assessment of the Preterm and Full-Term Newborn Infant, 2nd edn. Clinics in Developmental Medicine 148, London, McKeith Press.
- Estan J and Hope P (1997) Unilateral neonatal cerebral infarction in full term infants. Arch Dis Child 76, F88–F93.
- Filipeck PA, Krishnammorthy KS, Davis KR et al. (1987) Focal cerebral infarction in the newborn: a distinct entity. Pediatr Neurol 3, 141–147.
- Fujimoto S, Yokochi K, Togari H et al. (1988) Outcome of neonatal strokes. AJDC 142, 1086–1088.
- Hill AD, Martin J, Danemann A et al. (1983) Focal ischaemic cerebral injury in the newborn: diagnosis by ultrasound and correlation with computed tomographic scans. Pediatrics 71, 790–793.
- Koelfen W, Freund M, Konig S et al. (1993) Results of parenchymal and angiographic magnetic resonance imaging and neuropsychological testing of children after stroke as neonates. Eur J Pediatr 152, 1030–1035.
- Koelfen W, Freund M and Varnholt V (1995) Neonatal stroke involving the middle cerebral artery in term infants: clinical presentation, EEG and imaging studies, and outcome. Dev Med Child Neurol 37, 204–212.
- Saeed N, Le Strange E, Rutherford M (1999) Cerebellum segmentation employing texture analysis and knowledge based image processing. 1SMRM. Abstract 2190.
- Larroche JCL and Amiel CE (1966). Thrombose de l’artere sylvienne a la period neonatale. Arch Fr Pediatr 23, 257–274.
- Levy SR, Abrams IF, Marshall PC et al. (1985) Seizures and cerebral infarction in the full term newborn. Ann Neurol 17, 366–370.
- Mannino FL and Trauner DA (1983) Stroke in neonates. J Pediatr 102, 605–610.
- Mantovani JF and Gerber GJ (1984) Idiopathic neonatal cerebral infarction. AJDC 138, 359–362.
- Mercuri E, Cowan F, Rutherford M et al. (1995) Ischaemic and haemorrhagic brain lesions in newborns with seizures and normal Apgar scores. Arch Dis Child 73, F67–F74.
- Mercuri E, Spano M, Bruccini F et al. (1996) Visual outcome in children with congenital hemiplegia: correlation with MRI findings. Neuropediatrics 27, 184–188.
- Mercuri E, Atkinson J, Braddick O et al. (1996) Visual function in perinatal cerebral infarction. Arch Dis Child75, F76–81.
- Mercuri E, Atkinson J, Braddick O et al. (1997) The aetiology of delayed visual maturation: short review and personal findings. Eur J Paed Neurol 1, 31–34.
- Mercuri E, Rutherford M, Cowan F et al. (1999) Early prognostic indicators of outcome in infants with neonatal cerebral infarction:a clinical EEG and MRI study. Pediatrics 103, 39–46.
- Mercuri E, Cowan F, Gupte G et al. Coagulation status in infants with neonatal cerebral infarction. Pediatrics (in press).
- Perlman JM, Rollins NK and Evans D (1994) Neonatal stroke: clinical characteristics and cerebral blood flow velocity measurements. Pediatr Neurol 11, 281–284.
- Rollins NK, Morriss MC, Evans D et al. (1993) The role of early MR in the evaluation of the term infant with seizures. Am J Neurol Radiol 15, 239–248.
- Rutherford MA, Pennock JM, Dubowitz LMS et al. (1997) Does the brain regenerate after perinatal infarction? Eur J Paed Neurol 1, 13–18.
- Sran SK and Baumann RJ (1988) Outcome of neontal strokes. Am J Dis Child 142, 1086–1088.
- Suzuki S and Wada Y (1992) Neonatal cerebral infarction: symptoms, CT findings and prognosis. Brain Dev 14, 48–52.
- Traunner DA and Mannino FL (1986) Neurodevelopmental outcome after neonatal cerebrovascular incident. J Pediatr 108, 459–461.
- Volpe JJ (1994) Neurology of the Newborn, 2nd edn. Philadelphia, Saunders.
- Wertheim D, Mercuri EM, Faundez JC et al. (1994) Prognostic value of continuous EEG in full term infants with hypoxic ischaemic encephalopathy. Arch Dis Child 71, F97–F102.
- Wulfeck BB, Trauner DA and Tallal PA (1991) Neurological, cognitive and linguistic features of infants after early stroke. Pediatr Neurol 7, 266–269.
- Zeki S (1993) A Vision of the Brain. Oxford, Blackwell Scientific Publications.