Metabolic disorders in the
neonate
Zoltan Patay, Nicola J Robertson and I Jane Cox
Chapter Contents
- Introduction
- Clinical and biochemical aspects of inborn errors of metabolism
- Conventional MR imaging in metabolic diseases in the neonate
- Diffusion-weighted MRI in neurometabolic disorders
- Single voxel proton MR spectroscopy in neonates with inborn errors of metabolism
- Specific inherited metabolic disorders
- Clinical management of inborn errors of metabolism in neonates
- Conclusion
- Summary
- Acknowledgments
- References
Introduction
Metabolic diseases are classically divided into two groups: inborn errors of metabolism and acquired metabolic disorders. Inborn errors of metabolism present with systemic metabolic abnormalities (acidosis, ketosis, ketoacidosis, etc.) and/or clinical signs and symptoms related to the involvement of one or more of the organ systems. These include the central and the peripheral nervous system (spinal cord, brain stem, cerebellum, basal ganglia, cerebral white and gray matter or peripheral nerve lesions), the musculoskeletal system (myopathy, dysostosis), some of the visceral organs (cardiomyopathy, hepatosplenomegaly) and even the skin (alopecia, dermatitis, petechiae).
Inborn errors of metabolism that involve exclusively the nervous system are referred to as neurometabolic diseases. They include l-2-hydroxyglutaric aciduria, glutaric aciduria type 1, 4-hydroxybutyric aciduria, alpha-ketoglutaric aciduria, mevalonic aciduria and N-acetylaspartic aciduria (Canavan’s disease), none of which is encountered in neonates. Some of the metabolic disorders have no neurological manifestations at all (e.g. glycogen storage disorders).
Acquired metabolic disorders are relatively frequent in neonates receiving intensive care. They often present with disturbances of the central nervous system but there are few reports of associated brain imaging abnormalities. In acquired metabolic disorders, neurological complications may occur as a direct effect of the abnormality, from associated hypoxic– ischemic injury or may be secondary to the treatment. Benign forms of hyperbilirubinemia are often seen in neonates and typically resolve without sequelae; however, delayed or inappropriate treatment of more severe forms potentially leads to basal ganglia disease. Kernicterus is associated with abnormalities within the globus pallidum, subthalamic nuclei and hippocampus. Spectroscopy in this disorder may be unremarkable (Fig. 17.1). Hypoglycemia is a relatively common cause for admission on to a neonatal unit and is occasionally associated with severe white matter injury (see Chapter 6).

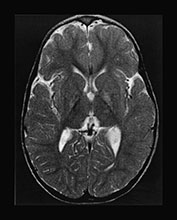


Fig. 17.1 Kernicterus discovered in a 3-year-old boy presenting with dystonia and movement disorders. Axial (a–b) and coronal (c–d) T2 weighted fast spin echo sequences. The lesions in the globus pallidum are well appreciated on both the axial and coronal images, but signal changes within the subthalamic nuclei are visible only on the coronal image (c). T1 weighted images of a term-born infant with hyperbilirubinemia examined at 6 days (e) and at 7 months (f). There is a normal appearance to the brain. Myelination is appropriate for age. There is a slightly widened appearance to the anterior portion of the posterior limb of the internal capsule (arrow). This increased signal intensity was seen more clearly and bilaterally on the lower slice and was consistent with abnormal signal intensity within the globus pallidum. (g) 1H MRS spectrum (TE 270ms) from a 2cm x 2cm voxel in the basal ganglia. The spectrum was acquired at 6 days of age and demonstrates a lactate/Cr of 0.23 and a NAA/Cr of 1.47. These values are within the normal range for a term infant. (h) 1H MRS spectrum (TE 270ms) from a 2cm x 2cm voxel in the basal ganglia. This spectrum was acquired at 7 months of age and demonstrates a lactate/Cr of 0.1 and a NAA/Cr of 1.74. These values are within the normal range for an infant at this age; the NAA/Cr has increased with maturation. The neurodevelopmental outcome was normal at one year of age.
< prev | top | contents | next >
Clinical and biochemical aspects of inborn errors of metabolism
Most of the inborn errors of metabolism of neonatal onset fall into the category of the devastating metabolic diseases, which refers to a fairly well-defined clinical syndrome, typically seen in neonates and infants. In the devastating metabolic diseases the underlying metabolic derangements result in global brain toxicity leading to diffuse brain edema and neurological manifestations that reflect the varying patterns and degrees of white or gray matter involvement. The clinical hallmarks of the condition are poor feeding, vomiting, seizures, stupor and lethargy rapidly leading to deep coma and subsequently to death or severe neurological impairment in the survivors.
AGE OF ONSET
The age of onset is often an important diagnostic and prognostic factor in metabolic diseases. Some diseases are exclusive to the neonatal age group; the onset of the underlying metabolic derangement may, however, be either pre- or postnatal. Neonatal or early infantile onset is usually related to a more profound metabolic derangement, whereas later onset often but not always reflects a less severe metabolic derangement with better prognosis.
In some of the diseases (primary lactic acidosis, type 2 glutaric aciduria, very long-chain acyl coenzyme A dehydrogenase, hydroxymethylglutaryl (HMG)-CoA lyase, ornithine transcarbamylase and carbamyl phosphatase synthetase deficiencies) the metabolic derangements manifest immediately at birth. In others clinical signs and symptoms develop a few days later (isovaleric acidemia, methylmalonic acidemia, propionic acidemia, non-ketotic hyperglycinemia, citrullinemia, argininosuccinic aciduria). Maple syrup urine disease (MSUD) typically presents 6–7 days after birth. A significant proportion of metabolic diseases with clinical onset after the 4th week of life are considered to be early or late infantile, childhood and juvenile, and are not therefore discussed here.
CLINICAL SIGNS AND SYMPTOMS
Neonates with metabolic disorders may present with dysmorphic features involving the mid-facial structures, for example in propionic and methylmalonic acidemias, multiple coenzyme A dehydrogenase deficiency or in peroxisomal disorders of neonatal onset but these may also develop later, for example the characteristic face in Cockayne and MSUD. In some of the diseases imaging studies may reveal malformations of the brain, for example cortical dysplasia in Zellweger syndrome, callosal hypoplasia in non-ketotic hyperglycinemia. Malformations of the brain always suggest a profound metabolic derangement of prenatal onset. Abnormal odor of the skin, hair, earwax or urine is a frequent and often characteristic feature of metabolic diseases, for example ‘sweaty feet’ in glutaric aciduria type 2 and isovaleric acidemia, ‘burnt sugar’ in MSUD, ‘cat urine’ in multiple carboxylase deficiency. Ophthalmological abnormalities may provide useful additional clues to the diagnosis, for example cataract in rhizomelic chondrodystrophia punctata, retinal degeneration in Zellweger syndrome. Fatty acid oxidation disorders typically present with hepatosplenomegaly, myopathy and cardiomyopathy. On neurological examination, neonates with urea cycle defects, non-ketotic hyperglycinemia and peroxisomal disorders typically present with severe hypotonia. In a few other diseases, such as MSUD, episodes of hypertonia (opisthotonus) may alternate with hypotonia. In organic acidemias both hypotonia (e.g. in propionic acidemia) and hypertonia (e.g. methylmalonic acidemia, isovaleric acidemia) may be observed. Hypertonia (contractures) is characteristic in rhizomelic chondrodystrophia punctata.
Epileptic seizures, usually myoclonic in neonates (in urea cycle defects, non-ketotic hyperglycemia) with occasional grand mal seizures later during infancy (organic acidemias, Zellweger syndrome, Menkes disease) are frequent and represent severe neurological complications in metabolic diseases. In fatty acid oxidation disorders epileptic seizures are related to hypoglycemia.
Acute metabolic crises often mimic infection (meningo-encephalitis) of the central nervous system but at the same time patients with organic acidemia, urea cycle defect and MSUD are prone to intercurrent infectious complications. This may result in confusing clinical presentations potentially leading to a delay in diagnosis and treatment.
LABORATORY FINDINGS
Laboratory analysis of body fluids (blood, urine, cerebrospinal fluid) is an essential part of the diagnostic work-up in metabolic diseases. Routine biochemical findings are often non-specific but may be suggestive or characteristic of certain disease groups or even disease entities. Analysis of blood pH, glucose, ammonia, lactic acid, urine ketone bodies and hepatic profile provides useful baseline information and guide any further diagnostic work-up.
One of the most important laboratory tests in neonates with a suspected metabolic disorder is the blood ammonia level. It is usually normal or borderline elevated in MSUD, and markedly elevated in both urea cycle defects and organic acidemias. If blood ammonia level is higher than 1000mm, irreversible neurological damage is likely to occur. These two groups can be differentiated from each other by determining the blood pH, which will reveal a respiratory alkalosis in the former and a metabolic acidosis in the latter.
The metabolic acidosis can further be characterized by the presence or absence of lactic acidosis and ketosis. A blood sugar level assessment is also important.
Lactic acidosis with hypoglycemia is typically seen in HMG CoA lyase deficiency14, in some subtypes of 3-methylglutaconic acidemia, glutaric aciduria type 2 and in medium- and long-chain fatty acid oxidation disorders.
Lactic acidosis with normoglycemia may be present in oxidative phosphorylation diseases (primary lactic acidosis). Determination of the pyruvate–lactate ratio may be helpful in identifying the different forms, such as pyruvate dehydrogenase deficiency (pyruvate/lactate <1/25) and pyruvate carboxylase deficiency or cytochrome c oxidase deficiency (pyruvate/lactate >1/35).
Ketosis with hypoglycemia is seen in patients with isovaleric, propionic and methylmalonic acidemia and in ketothialase deficiency. Adrenal insufficiency, sepsis, and dehydration may, however, also present with similar laboratory findings.
Ketosis with hyperglycemia is present in diabetic ketoacidosis.
Severe acidosis without lactic acidosis or ketosis may be seen periodically in 5-oxoprolinuria.
Hepatic function may be altered in inborn errors of metabolism of neonatal onset. Clinical and laboratory evidence of liver disease are typically present in fatty acid oxidation and oxidative phosphorylation disorders. High plasma levels of phytanic, pipecolic and very long chain fatty acids (VLCFA), as well as bile acid intermediates are typical findings in peroxisomal diseases.
More sophisticated biochemical techniques that may be needed to reach a specific diagnosis include; gas chromatography/mass spectrometry (GC/MS) of the urine, high pressure liquid chromatography (HPLC) and tandem mass spectrometry (tandem MS) of the blood. In addition there are specific enzyme studies, for example glutathione reductase assay of red blood cells in 5-oxoprolinuria, propionyl-CoA carboxylase or HMG-CoA lyase assay in white blood cells in propionic acidemia and HMG-CoA lyase deficiency and pyruvate carboxylase or cytochrome c oxidase assay in liver or muscle biopsy specimen in oxidative phosphorylation disorders.
< prev | top | contents | next >
Conventional MR imaging in metabolic diseases in the neonate
TECHNICAL CONSIDERATIONS
Sequence selection
Differences in the histochemical properties (water and myelin content) between the immature (newborns and infants) and the mature (children and adults) brain requires appropriate adjustment of some of the parameters of conventional spin echo or fast spin echo sequences. To compensate for the longer T2 relaxation time (due to the high water and lower myelin/lipid content) of the brain parenchyma in the newborn and infant, longer repetition (TR) and echo (TE) times are used in T2 weighted imaging.
To enhance signal differences between the myelinated and the non-myelinated structures ‘myelin sensitive’ inversion recovery techniques (‘real’ and ‘modular’) provide optimal results.
Spatial resolution
Accurate analysis and identification of the involved anatomical structures (especially in the cerebellum and the brain stem), which are indispensable for lesion-pattern recognition by MRI, may require the use of a high-resolution (512 x 512) matrix.
Slab orientation
The use of multiplanar imaging is necessary to detect and delineate lesions involving specific areas of the brain. Mid-line structures such as the corpus callosum and the cerebellar vermis are best assessed on sagittal images (Fig. 17.2). The cerebellar white matter, the dentate (Fig. 17.3) and subthalamic nuclei (Fig. 17.3) and the tails of the caudate nuclei are best imaged in the coronal plane. The brain stem structures, the basal ganglia, the internal capsules, the cerebral hemispheric white matter and the cortex are best visualized on axial images.
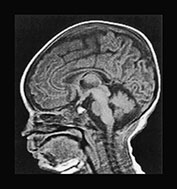

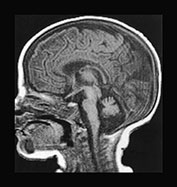
Fig. 17.2 The mid-line structures on sagittal T1 weighted spin echo images in metabolic diseases in neonates. (a) Normal corpus callosum and cerebellar vermis in a 7-day-old male neonate with primary lactic acidosis. Accurate analysis of the corpus callosum may be challenging in neonates because of its small size and lack of myelin. (b) Dysmorphic/hypotrophic corpus callosum in a 2-month-old female infant with non-ketotic hyperglycinemia. (c) Hypo- or dysplastic cerebellar vermis in a 40-day-old male infant with methylmalonic acidemia.


Fig. 17.3 Coronal T2 weighted fast spin echo images in an 18-month-old boy with propionic acidemia presenting with acute metabolic crisis. Predominantly the gray matter structures are involved. The cerebral cortex, the putamina, the tails of the caudate nuclei and the subthalamic nuclei (a) as well as the dentate nuclei and the cerebellar cortex (b) exhibit an abnormal hyperintense appearance. Most of these structures are best assessed in the coronal plane.
The baseline MRI work-up of a newborn, suspected to have metabolic disease should include sagittal T1 weighted spin echo, axial proton density and T2 weighted fast spin echo and axial fast inversion recovery sequences. Optional techniques include axial or coronal T2 weighted fast spin echo or modular inversion recovery sequences. Whenever possible, the use of a high-resolution matrix is preferred. Depending on the findings, additional axial or coronal diffusion-weighted echo-planar sequences and an MR spectroscopic study may be indicated to enhance the sensitivity and diagnostic specificity.
Intravenous contrast injection is usually not necessary in metabolic diseases of neonatal onset (except neonatal adrenoleukodystrophy, see later) but may be indicated where there is a suspicion of infection.
MRI findings in neonates with metabolic disorders are usually non-specific, even in those diseases, which eventually lead to fairly characteristic lesion patterns. Very few diseases present with suggestive or pathognomonic abnormalities in the immediate postnatal period. The combination of conventional and diffusion-weighted MRI as well as MR spectroscopy may however lead to a more specific diagnosis.
< prev | top | contents | next >
Diffusion-weighted MRI in neurometabolic disorders
Although the technique itself is not new, only recent improvements in MR gradient technology in the form of fast and powerful gradient subsystems have allowed the implementation of echo-planar diffusion-weighted imaging (EP-DWI) in routine practice. The short acquisition times (20–50s) are particularly advantageous in pediatric patients. Diffusion-weighted MRI of the brain has already many well-established indications, including stroke and the assessment of normal and abnormal myelination5. Analysis of the type and pattern of diffusion abnormalities may enhance the sensitivity and specificity of the MRI work-up in neonates.
In non-myelinated white matter, some but not significant water diffusion anisotropy is present and the apparent diffusion coefficient is higher than in the mature brain. As the myelination process progresses, prominent diffusion anistrophy develops, characterized by relatively free water diffusion along the fiber tracts and restricted diffusion across the myelin sheaths29, 42. Besides the presence of extra- or intracellular barriers (myelin layers, cell or organelle membranes, fiber tracts) other possible causes of water diffusion restriction in the brain parenchyma include increased extra- or intracellular microviscosity, which is induced by the presence of macromolecules.
In cytotoxic (intracellular) edema water accumulates within the cells (due to intracellular retention of sodium), where its diffusion is restricted in all directions. Isotropically restricted water diffusion presents with hypersignal on diffusion-weighted images. In vasogenic edema excess water moves into the extracellular space. As a result, the apparent tissue water diffusion increases, isotropically in the gray matter, and with a preferential direction along the fiber tracts in the white matter.
In vivo demonstration of pathological water diffusion is clinically important because with conventional MRI techniques dys- or demyelination and all types of brain edema present with similar signal changes (hyposignal on T1 and hypersignal on the T2 weighted images). Differentiation between them based on T1 or T2 relaxation properties is almost impossible. By demonstrating abnormal water shifts between the extra- and intracellular spaces and the resultant apparent water diffusion changes, DWI has the unique potential to differentiate between vasogenic and cytotoxic edema10. Furthermore, different types and stages of myelin breakdown (dys- and demyelination) may also be identified based on water diffusion properties within the central nervous system31.
A specific form of brain edema (‘myelin edema’) related to vacuolating (or spongioform) myelinopathy has a peculiar appearance on diffusion-weighted images. Histopathologically, vacuolating myelinopathy is found in some of the neurometabolic diseases, such as Canavan’s disease, van der Knaap’s disease43, l-2-hydroxyglutaric aciduria and neonatal MSUD. In vacuolating myelinopathy water is probably trapped within vacuoles between the myelin sheet layers, leading to isotropically restricted water diffusion. This explains the markedly increased signal intensities in areas of active vacuolating myelinopathy on diffusion-weighted images in MSUD (Fig. 17.15). It is similar to the appearance in cytotoxic edema although the underlying pathological mechanisms are distinctly different (Fig. 17.4). Additionally, this also allows clear differentiation between myelinated and non-myelinated structures in the neonatal brain, since in MSUD vacuolating myelinopathy presents with isotropically restricted water diffusion (hypersignal) and the non-myelinated white matter with diffusion abnormalities (hyposignal) suggestive of vasogenic edema. Hence, as a by-product, a very accurate in vivo myelination map is obtained (Fig. 17.15).


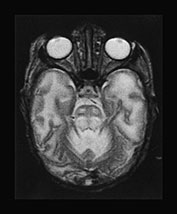


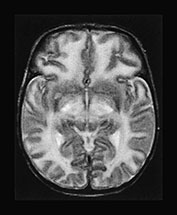

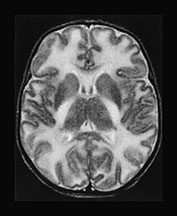
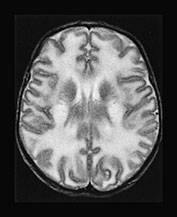

Fig. 17.4 Axial T2 weighted fast spin echo images in a 20-day-old male infant with MSUD. Marked T2 prolongation is seen in all of the structures, which are normally myelinated in the newborn (vacuolating myelinopathy). The non-myelinated white matter structures are relatively spared but diffuse brain swelling is clearly demonstrated (vasogenic edema) (see also Fig. 17.15).
It is noteworthy that histopathological studies describe vacuolating myelin changes both in the classical (neonatal) and atypical (late-onset) forms of non-ketotic hyperglycinemia. It is therefore possible that diffusion-weighted imaging would reveal changes (hypersignal related to isotropically restricted water diffusion) similar to those observed in MSUD, potentially causing a problem differentiating the two disorders.
Cellular swelling in non-ischemic conditions may also lead to significant anisotropical restriction of water diffusion and present with hypersignal on diffusion-weighted images (hyposignal on anisotropic diffusion coefficient (ADC) maps). This phenomenon is not infrequently encountered at the level of the basal ganglia in active metabolic diseases, in particular organic acidemias, indicating an on-going cellular dysfunction, potentially leading to cell death and extensive tissue necrosis. This, however, has not been observed in neonates presenting with acute neurometabolic disease.
< prev | top | contents | next >
Single voxel proton MR spectroscopy in neonates with inborn errors of metabolism
In a routine clinical setting the single voxel proton MR spectroscopy is the preferred technique. A more detailed account of the techniques used to obtain MR spectra has been given in the previous chapter. The spectroscopy findings in inborn errors of metabolism may be non-specific, although sometimes suggestive or characteristic, or specific.
NON-SPECIFIC FINDINGS
In most of the neurometabolic diseases with neonatal onset proton MR spectroscopic findings are non-specific. Nevertheless, they can provide useful additional information on the basic pathological processes occurring within the brain parenchyma. Alterations in the normal constituents of the spectra such as N-acetyl aspartate (NAA), choline (Cho), and creatine (Cr) may be identified, reflecting various degrees of loss of neuronal integrity, myelin breakdown and impairment of basic energetic processes.
Lactate in the brain parenchyma is a non-specific indicator of neurometabolic disease. However, in the neonate, particularly the preterm neonate, a small amount of lactate may be a normal finding (see Chapter 16).
SPECIFIC FINDINGS
Disease-specific metabolites are rarely present but may be occasionally identified in some of the metabolic disorders with neonatal onset. Branched chain amino acids (l-leucine, l-isoleucine, valine) in MSUD, and glycine (Gly) in non-ketotic hyperglycinemia are the best-known examples. Other disease specific abnormalities include increased N-acetyl-aspartate in Canavan’s disease2, 17, 24 and absence of creatine in guanidinoacetate methyltransferase deficiency38.4 (Fig. 17.5) but these disease are typically seen in the infantile age group.
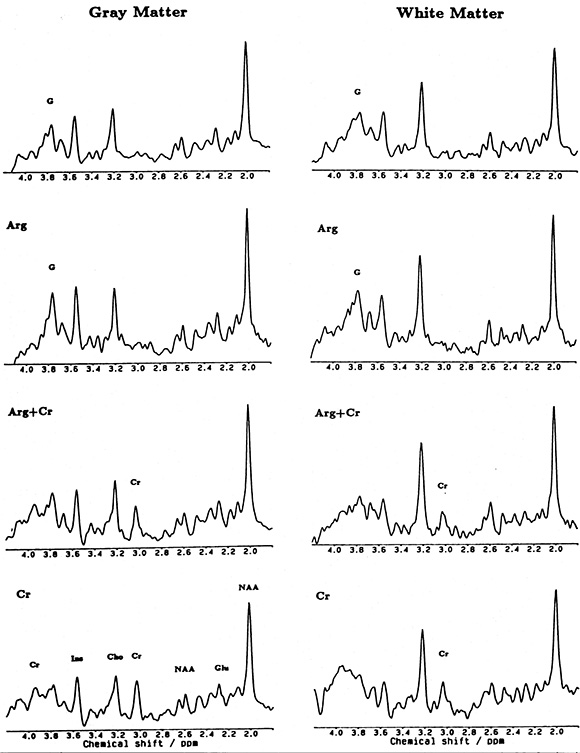
Fig. 17.5 Localized proton MR spectrum of parietal gray matter (left: 18ml volume) and white matter (right 7.7ml volume) in a patient with complete creatine deficiency (top traces), in the patient at 22 months of age after a 4-week substitution of l-arginine (second row of traces), and after a 6-week substitution of creatine (bottom traces). Resonances assignments are due to N-acetylaspartate (NAA), glutamate (Glu), creatine and creatine-phosphate (Cr), choline-containing compounds (Cho), myo-inositol (Im), and guanidinoacetate (G). (Reproduced with permission of International Pediatric Research Foundation, Inc. from Stöckler et al. Creatine deficiency in the brain: a new, treatable inborn error of metabolism. Pediatr Res (1994) 36(3), 409–413.)


Fig. 17.6 Axial T2 weighted fast spin echo images in a 2-day-old female neonate with methylmalonic acidemia. Diffuse brain swelling and T2 prolongation of the non-myelinated white matter (e.g. ventral mesencephalic structures on (b) and hemispheric white matter on (d) are demonstrated.
< prev | top | contents | next >
Specific inherited metabolic disorders
ORGANIC ACID DISORDERS
Methylmalonic acidemia
Five discrete metabolic deficits may result in methylmalonic acid in the blood.
Enzyme deficiency
Methylmalonyl coenzyme A mutase partial or complete deficiency. Hydroxycobalamine reductase deficiency and cobalamine adenosyltransferase deficiency, which are both related to an abnormality in vitamin B12 metabolism.
Inheritance
Autosomal recessive.
Genetics
The encoding gene for the mutase enzyme is located on chromosome 6.
Metabolic features
The excess metabolite, methylmalonyl coenzyme A, inhibits multiple other systems that are involved in gluconeogenesis (pyruvate carboxylase), the urea cycle (N-acetylglutamate synthetase) and the glycine cleavage system in the liver but not in the brain, unlike in non-ketotic hyperglycinemia. Neonates present with hyperglycinemia, hyperammonemia and ketoacidosis during the first few days of life (60%) or in early infancy (40%). Sixty per cent of the neonates present with hypoglycemia secondary to impairment in gluconeogenesis30.
Clinical features
Vomiting, stupor, tachypnea and occasionally seizures. The clinical onset varies with the enzymatic defect. All infants with complete mutase deficiency present within 7 days of delivery.
Clinical course
Excess methylmalonic acid has effects on myelin and also on the external granular layer of cerebellum (Fig. 7.2c). In neonates presenting with complete mutase deficiency, 60% die and 40% survive with neurological impairment.
Treatment
The outcome may be improved in some infants if they are diagnosed and treated early with a low protein diet and with supplements of cobalamin and l-carnitine. Some patients may respond to high-dose vitamin B12.
Imaging
In neonates the disease presents with unremarkable or non-specific MRI findings. Mild swelling of the brain may be seen, in conjunction with T2 prolongation within the non-myelinated white matter structures, most probably related to vasogenic edema. The myelinated white matter structures; in the brain stem, the posterior limbs of the internal capsules, etc. appear to be spared. In one case hypoplasia of the cerebellar vermis was also observed. After the acute phase, atrophy of the brain may develop. In the chronic phase of the disease, bilateral globus pallidus lesions are found. This, when present, is a fairly characteristic imaging finding, but unfortunately it is not conspicuous in the neonate (Fig. 17.2c and Fig. 17.6).
Propionic acidemia
Enzyme deficiency
Propionyl coenzyme A carboxylase.
Inheritance
Autosomal recessive.
Genetics
This is a ‘mitochondrial’ disease since the deficient enzyme – propionyl coenzyme A carboxylase – is located within the mitochondria. Encoding genes have been found on both chromosome 3 (beta subunits) and 13 (alpha subunits).
Metabolic features
The neonatal form presents with increased ammonia levels, erroneously suggesting a urea cycle defect. Ketosis, acidosis (metabolic and lactic) and hypoglycemia are found in conjunction with increased glycine levels (see above in methylmalonic acidemia). For the aforementioned reasons the disease is also called ‘ketotic hyperglycinemia’. The co-factor of the enzyme is biotin; hence other enzyme deficiencies (multiple carboxylase deficiency, see later in 3-methylcrotonyl coenzyme A carboxylase deficiency) related to impairment of the biotin cycle (holocarboxylase synthetase, biotinidase) may cause diagnostic problems.
Clinical features
The disease has a severe neonatal (80–90%) and a milder infantile (10–20%) onset variant. Skin rashes, hypotonia, lethargy, dehydration, seizures and irregular breathing are seen in the neonate before severe acidosis leads to coma and death.
Clinical course
Prognosis in the late-onset form is much better. If the ketoacidotic metabolic crises which are often triggered by infection, fasting, constipation or high protein intake are successfully prevented, affected patients may reach adult age.
Treatment
Low protein diet with l-carnitine supplementation.
Imaging
In the infantile-onset form, propionic acidemia is a predominantly gray matter disease. Involvement, with swelling and signal intensity changes, of the dentate nuclei, the basal ganglia and the cerebral cortex is well appreciated on the MR images during the acute metabolic crisis. In the chronic phase, necrosis of the basal ganglia, diffuse brain atrophy and occasionally patchy white matter lesions are present. In the neonate these changes are not evident. Instead, diffuse brain edema and subsequently delayed myelination and atrophy are the most typical findings6 (Fig. 17.3 and Fig. 17.7).
Spectroscopy
A decrease in NAA and myo-inositol and an increase in glutamate/glutamine have been found with short echo time (STEAM) proton MR spectroscopy6 (Fig. 17.8). MR spectroscopy may demonstrate lactic acidosis during a metabolic crisis.


Fig. 17.7 Axial T2 weighted fast spin echo images in a 16-day-old female neonate with propionic acidemia. The findings are rather unremarkable and non-specific, only diffuse brain swelling is seen. Foldover artifacts project over the cerebellar hemisphere and the occipital lobe on the left side (a), (b).


Fig. 17.8 Proton MR spectroscopy obtained with the PRESS technique at 270ms echo time (a) and the STEAM technique at 20ms echo time (b) in a 28-day-old infant with propionic acidemia. The sampling voxels (2 x 2 x 2cm) were placed on the hemispheric white matter. Both spectra show significant decrease of the NAA (2.02ppm) and elevation of the myo-inositol (3.55ppm) peaks. Abnormal lactate (1.3ppm) is demonstrated on the first spectrum (a).
< prev | top | contents | next >
PRIMARY LACTIC ACIDOSIS (OXIDATIVE PHOSPHORYLATION DISORDERS)
Lactic acid is the product of anaerobic metabolism of glucose. Lactic acidosis is frequently related to inborn errors of metabolism as either a primary or secondary lactic acidosis but it may also be acquired. Primary lactic acidosis may be caused by impairment of lactate and pyruvate oxidation, disorders of the Krebs cycle and of the respiratory chain. Secondary lactic acidosis is present in several metabolic diseases, notably in organic acidemias, urea cycle and fatty acid oxidation defects. Acquired causes of lactic acidosis include cardiopulmonary disease, severe anemia, malignancy, diabetes mellitus, hepatic failure and postconvulsion status or can be drug-related. Mitochondrial enzyme defects that cause primary lactic acidosis include pyruvate transcarboxylase, pyruvate dehydrogenase and cytochrome c oxidase deficiencies. These all have neonatal as well as later-onset forms. The remarkable phenotypic variability of the mitochondrial diseases is due to the segregation of the mutant mitochondria and the resultant heteroplasmy.
Pyruvate dehydrogenase deficiency
This is the most frequent cause of primary lactic acidosis. The enzyme has three subunits (E1, E2 and E3), which are all prone to mutations.
Inheritance
Depending on the chromosomal location of the gene encoding the defective subunit, the inheritance may be autosomal (E1-beta, E2, E3) or X-linked (E1-alpha subunit). Leigh syndrome, which usually presents in infancy but may also present in the late neonatal period, has an autosomal recessive inheritance.
Metabolic features
Lactic and pyruvic acidosis and hyperalaninemia.
Clinical features
There are three forms of presentation within the neonatal period:
(1) A severe neonatal form presenting within the first week and often within the first 24h with fulminating lactic acidosis, stupor, tachypnea, hypotonia and seizures.
(2) An infantile form presenting with hypotonia, dysmorphic craniofacial features, mild acidosis and cerebral dysgenesis including agenesis of the corpus callosum and subependymal heterotopias. These infants are usually female and are heterozygous for the X-linked form of the disorder.
(3) An infantile form presenting with early-onset Leigh disease with hypotonia, respiratory difficulties, oculomotor abnormalities, facial weakness and seizures.
Clinical course
Almost all infants with the severe neonatal form die within 8 months. In the milder neonatal form with dysmorphic features there is usually severe neurological impairment and the development of microcephaly. In Leigh disease there is usually developmental arrest, later onset of movement disorders and developmental regression.
Treatment
Early recognition and treatment of the acidosis are vital. Long-term therapy includes a ketogenic diet to provide sufficient calories as fat. Fat, unlike carbohydrate, by-passes the enzymatic defect and provides a source of acetyl-CoA. Initially treatment with additional l-carnitine may be useful. A trial of high dose thiamine is also appropriate, as there have been reports of thiamine dependence.
Pyruvate carboxylase deficiency
Inheritance
Autosomal recessive.
Metabolic features
Infants present with lactic and pyruvic acidosis and ketosis. Hyperalaninemia, hyperammonemia, citrullinemia, hyperlysinemia occur secondary to disturbance of the urea cycle. Hypoglycemia is not a prominent feature despite the role of pyruvate carboxylase in hepatic gluconeogenesis. There is increased conversion of pyruvate to acetyl-CoA, which is converted to fatty acids and ketone bodies because of the disturbance in the Krebs cycle.
Clinical features
There are two clinical forms: a fulminant neonatal and a later infantile form. The fulminant neonatal form presents with stupor, coma, tachypnea and seizures.
Clinical course
In the neonatal form the resultant lactic acidosis is severe and rapidly fatal, in the infantile form the metabolic derangement may be milder and life expectancy is somewhat longer.
Treatment
Dietary therapy is difficult. A relatively high carbohydrate diet is recommended but with no substantial effects reported. A high fat diet is not indicated partly because ketosis is a prominent feature.
Cytochrome c oxidase deficiency
Cytochrome c oxidase is one of the five multi-subunit enzyme complexes forming the so-called respiratory chain located within the inner membrane of the mitochondrion and is responsible for the electron transport during the end-stage of oxidative phosphorylation.
Inheritance
Respiratory chain defects are mostly related to maternally inherited mitochondrial DNA mutations but since nuclear DNA also plays a role in the encoding of some of the complexes, autosomal and even X-linked forms are also known.
Metabolic features
Infants present with lactic acidosis and mild pyruvic acidosis. The creatine phosphokinase is only mildly elevated.
Clinical features
Neonatal forms present with severe hypotonia, weakness and hyporeflexia. Respiratory failure develops.
Clinical course
Infants usually die in early infancy. A benign form exists which presents identically but infants show gradual improvement and may be normal at 2–4 years of age. These forms may only be distinguished by identifying the subunits that are absent on muscle histochemistry.
Treatment
Intensive supportive therapy is warranted until the exact form of the disorder can be identified.
Imaging (in oxidative phosphorylation disorders)
Infants with the less severe neonatal form of pyruvate dehydrogenase deficiency may show congenital malformations such as callosal agenesis or disturbances of neuronal migration. The conventional MRI findings are otherwise non-specific in neonates with this group of disorders. Diffuse brain swelling is seen with prolongation of the T2 relaxation time within the white matter throughout the entire brain, perhaps with some predilection to the non-myelinated structures. At the early stage no definite structural or signal abnormality is seen within the basal ganglia although they may appear swollen. In survivors the disease leads to prominent cerebral atrophy and/or delayed myelination (Fig. 17.9). Basal ganglia disease with atrophy and signal intensity changes suggestive of necrosis also develops in the severe therapy-resistant cases.
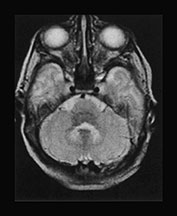


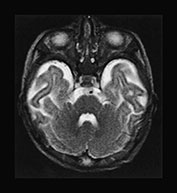


Fig. 17.9 Axial T2 weighted fast spin echo images in a 5-day-old (a–d) and a 3-month-old (e–h) female patient with primary lactic acidosis. In the patient examined in the early postnatal period only mild brain swelling is seen. In the other child very prominent brain atrophy is found in conjunction with delayed myelination.
< prev | top | contents | next >
Spectroscopy (in oxidative phosphorylation disorders)
The ability to detect lactate makes 1H magnetic resonance spectroscopy (MRS) a useful tool to diagnose and follow these patients. Studies using combined 1H MRS and 18F deoxyglucose (FDG) positron emission tomography to assess two aspects of glycolysis (glucose uptake and lactate deposition) demonstrate that defects in oxidative phosphorylation cause a massive increase in glycolysis to cover energy requirements with corresponding accumulation of lactate in brain tissue19. In Leigh disease high signal intensities are seen in the putamen and caudate heads on T2 weighted MR images3 (Fig. 17.10) with high brain lactate concentrations on localized 1H MRS. Regional variation in the concentration of cerebral lactate in mitochondrial disorders has also been demonstrated9 (Fig. 17.10 and Fig. 17.11) and lactate has been detected in areas of brain thought to be ‘normal’ on MRI41. 1H MRS has been used effectively to monitor therapy in Leigh disease and appears to be a better measure of response than CSF or plasma lactate. In the latter case39 brain lactate could be detected even when the CSF lactate level had normalized; continuing neuronal loss and breakdown of membrane phospholipids were reflected by a decrease in NAA/Cr and an increase in Cho/Cr (Fig. 17.12).

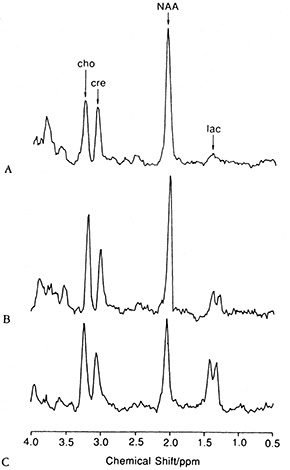
Fig. 17.10 (a) A T2 weighted axial MRI scan through the basal ganglia showing focal hyperintensity characteristic of Leigh syndrome (TR = 3000ms; TE = 120ms). The locations in this plane of 25-mm3 regions of interest chosen for spectroscopy from the basal ganglia and from a normal appearing region in the occipital lobe are shown. (b) Water-suppressed 1H MR spectra obtained from normal cortex (A), occipital lobe in a patient with Leigh syndrome (B), and right basal ganglia in a patient with Leigh syndrome (C). Spectra are plotted on equal signal intensity scales. Singlet resonances from choline (cho, 3.2ppm), creatine (cre, 3.0ppm), N-acetylaspartate (NAA, 2.0ppm), and the lactate doublet (lac, 1.3ppm) are clearly resolved. Levels of lactate are elevated in both B and C, whereas N-acetyl aspartate is most markedly decreased in C. (Reproduced with permission of the American Neurological Association from Detre et al. Regional variation in brain lactate in Leigh syndrome by localised 1H magnetic resonance spectroscopy. Ann Neurol (1991) 29(2), 218–221.)

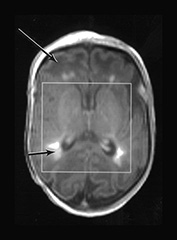

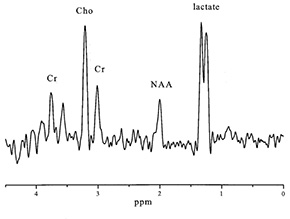
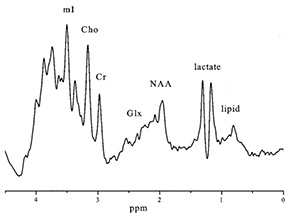

Fig. 17.11 Infant with pyruvate dehydrogenase deficiency, born at term and scanned at 16 days (a)(i)(ii) T1 weighted image. There is only patchy and abnormal high signal intensity from myelin within the posterior limb of the internal capsule. The white matter has abnormal low signal intensity, most marked frontally (long arrow). There are focal areas of abnormal high signal intensity in the periventricular white matter consistent with hemorrhage (short arrow). (b) T2 weighted image. The white matter has abnormal high signal intensity (long arrow). The hemorrhagic areas are seen as low signal intensity (short arrow). There is no obvious low signal form myelin within the posterior limb. (c) 1H MRS spectrum (TE 270ms) from a 2cm x 2cm x 2cm voxel in the basal ganglia. The lactate/Cr is markedly raised (3.96) and the NAA/Cr is low (0.8). (d) 1H MRS spectrum (TE 40ms) from a 2cm x 2cm x 2cm voxel in the basal ganglia demonstrating a raised myo-inositol/Cr of 2.13. (e) 31P MRS spectrum from the whole brain (5.5cm x 5.5cm x 5.5cm voxel) demonstrating an alkaline pHi of 7.17


Fig. 17.11 Proton MR spectroscopy in a 7-day-old male infant with primary lactic acidosis (same patient as Fig. 17.2a). The spectra were obtained using the point-resolved spectroscopy (PRESS) technique, the sampling voxel (2 x 2 x 2cm) was placed on the basal ganglia on the right side. With 135ms echo time (a) a prominent negative doublet is seen at the 1.3ppm level, which becomes positive at 270ms (b) (J-coupling phenomenon).
< prev | top | contents | next >
ABNORMALITIES OF THE l-LEUCINE BREAKDOWN PATHWAY
Several inborn errors of metabolism are related to enzyme deficiencies along the complex l-leucine breakdown pathway. These disorders include MSUD, isovaleric acidemia, 3-methylcrotonyl-CoA carboxylase deficiency, beta-ketothiolase deficiency and (HMG)-CoA lyase deficiency. MSUD is the most common followed by isovaleric acidemia which accounts for approximately 15% of all organic acidurias.
(1) The first step of the catabolic process is the conversion of l-leucine into 2-ketoisocaproic acid by the branched-chain amino acid transaminase. No specific disease is known at this level.
(2) The second step is the conversion of 2-ketoisocaproic acid into isovaleryl coenzyme A by the branched-chain alpha-ketoacid dehydrogenase. Deficiency of this enzyme, which is also involved in the catabolism of l-isoleucine and valine, leads to MSUD (see later in amino-acidurias).
(3) Isovaleryl coenzyme A is converted into 2-methylcrotonyl coenzyme A. Deficiency at this level results in isovaleric acidemia.
Isovaleric acidemia
Enzyme deficiency
Isovaleryl coenzyme A dehydrogenase.
Inheritance
Autosomal recessive.
Metabolic features
The excess metabolite is isovaleryl coenzyme A. The disease is characterized by severe ketosis, lactic acidosis and hypoglycemia, due to the lack of gluconeogenesis, rapidly leading to coma. The associated thrombocytopenia may present clinically with disseminated intravascular coagulopathy.
Clinical features
An acute severe form accounts for about half the cases. Onset is usually between days 3 and 6 with vomiting, tachynea and stupor. The accumulation of isovaleric acid in body fluids results in a smell of sweaty feet.
Clinical course
Without treatment over half the neonates die and the remainder are left with neurological impairment.
Treatment
Aggressive acute treatment and long-term therapy with low protein diet and supplementation with carnitine and glycine has increased survival rates and improved the neurological outcome of survivors. Glycine combines with isovaleryl coenzyme A and is readily excreted by the kidneys.
Imaging
In a case of a 20-day-old neonate, there was already atrophy of the brain with fronto-temporal predominance. Delayed myelination was also suggested. On the T2 weighted images bilateral symmetrical signal abnormalities were seen within the posterior parts of the putamen (Fig. 17.13).
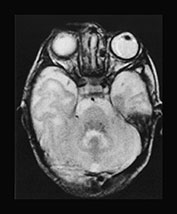

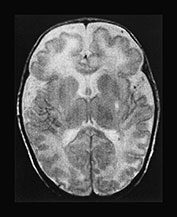
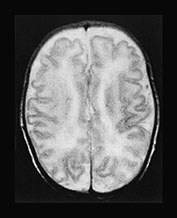
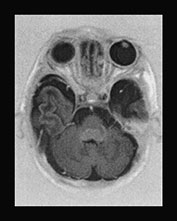


Fig. 17.13 A 20-day-old term male neonate with a diagnosis of isovaleric acidemia. The axial T2 weighted fast spin echo images (a–d) show a somewhat immature appearance of the brain with enlarged extracerebral CSF spaces and rudimentary gyral pattern in the frontal–temporal regions. Symmetrical hyperintensities are seen within the posterior parts of the putamina. The axial fast inversion recovery images (e–h) show very faint hypersignal within the posterior limbs of the internal capsules, the ventro-lateral parts of the thalami and the central centrum semiovale, suggestive of delayed myelination.
< prev | top | contents | next >
Spectroscopy
In a 5-month-old patient with isovaleric acidemia and normal MRI findings, no abnormality was demonstrated by proton MR spectroscopy using 135 and 270ms echo times16.
(4) Isolated dysfunction of the 3-methylcrotonyl coenzyme A carboxylase, responsible for the conversion of 2-methylcrotonyl coenzyme A into 3-methylglutaconyl coenzyme A is a rare condition. The 3-methylcrotonyl coenzyme A deficiency more often develops in a specific metabolic disease group, referred to as multiple carboxylase deficiency. The enzymes involved in multiple carboxylase deficiency are pyruvate carboxylase, propionyl coenzyme A carboxylase, acetyl coenzyme A carboxylase and 3-methylcrotonyl coenzyme A, for all of which biotin is an essential co-factor (see primary lactic acidosis, propionic acidemia). Deficiencies of these enzymes, including the 3-methylcrotonyl coenzyme A deficiency, therefore usually develop in conditions characterized by unavailability of biotin, notably in biotinidase or holocarboxylase synthetase deficiency.
Biotinidase deficiency
Biotinidase is responsible for the recycling of biotin released from the turnover of the different carboxylase enzymes. Biotinidase deficiency manifests with an insidiously developing progressive encephalopathy. In both the biotinidase and the rare isolated 3-methylcrotonyl coenzyme A carboxylase enzyme deficiencies delayed myelination was observed (Fig. 17.14).


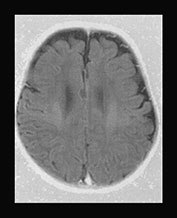


Fig. 17.14 Axial fast inversion recovery images in a 3-month-old female infant with 3-methylcrotonyl coenzyme A carboxylase deficiency (a–c) and a 50-day-old male infant with biotinidase deficiency (d–f). In both cases the myelination of the supratentorial structures is delayed for the respective ages of the infants.
< prev | top | contents | next >
Holocarboxylase deficiency
Holocarboxylase synthetase (HCS) is a biotin carrier, responsible for the attachment of biotin into the active center of 3-methylcrotonyl coenzyme A carboxylase or the other carboxylase enzymes. Holocarboxylase synthetase deficiency usually presents in neonates.
Inheritance
Autosomal recessive.
Genetics
The encoding gene is located on chromosome 21.
Metabolic features
Metabolic features include ketoacidosis, moderate hyperammonemia and hypoglycemia. The organic acidemia includes propionate, lactate, B methylcrotonate.
Clinical features
Neonates may present with vomiting, tachypnea, hypotonia and sometimes seizures.
Clinical course
Rare benign forms of the disease may be biotin responsive, otherwise the disease is lethal.
Treatment
Treatment is with high dose biotin, which may be given antenatally.
(5) Deficiency of the 3-methylglutaconyl coenzyme A (3-MGC) hydratase results in impairment of the conversion of 3-methylglutaconyl coenzyme A into 3-hydroxy-3-methylglutaryl coenzyme A (HMG-CoA). The resultant disease is one of the several forms of 3-methylglutaconic acidemia.
3-methylglutaconic acidemia
3-methylglutaconic aciduria (3-MGC) is a heterogeneous group of several biochemically and clinically distinct entities1.
Enzyme deficiency
In some of them (type 1) the underlying enzyme deficiency is known (3-MGC hydratase deficiency), in others (type 2, 3 and 4) it is unidentified.
Clinical features
Some patients present with pyramidal, others with extrapyramidal tract signs (e.g. Behr or Costeff syndrome: optic atrophy, ataxia, nystagmus, extrapyramidal signs, urinary incontinence, mental retardation) or both. Cardiomyopathy is present in an X-linked variety of the disease (Barth syndrome: X-linked cardiac and skeletal myopathy, short stature and neutropenia)4. Since neonatal lactic acidosis with hypoglycemia represents one of the typical laboratory manifestations of the disease, it may actually correspond to a complex mitochondrial disease.
Clinical course
The disease is therapy resistant, leading to death during the first few years of life in most cases.
Imaging
No imaging data are available in the neonatal age group. Later the disease typically presents with cerebellar atrophy and bilateral necrosis of the caudate nuclei and the putamina. In a patient, whose clinical presentation was highly suggestive of Behr syndrome (Behr or Costeff syndrome: optic atrophy, ataxia, nystagmus, extrapyramidal signs, urinary incontinence, mental retardation) MRI examination at the age of 2 years showed ventricular dilatation, bilateral putaminal signal changes in conjunction with extensive cystic lesions within the subcortical white matter26. The cystic lesions were already demonstrated by cranial ultrasound at the age of 6 months.
(6) The final step of the pathway is the breakdown of HMG-CoA into acetoacetate and acetyl coenzyme A. Deficiency at this level leads to a specific disease entity, referred to as HMG-CoA lyase deficiency.
HMG-CoA lyase deficiency
Enzyme deficiency
HMG-CoA lyase.
Metabolic features
HMG-CoA is indispensable in many biochemical processes, including cholesterol synthesis and the formation of ketone bodies; the latter are important nutrients of the brain. Additionally, excess HMG-CoA also inhibits the normal gluconeogenesis.
Clinical features
The Saudi phenotype32 of the disease typically (60%) presents in neonates, elsewhere the disease is characterized by infantile onset. The unavailability of endogenously synthesized ketone bodies and glucose has the potential to create a life-threatening hyperacute encephalopathy if glucose supply is restricted or the glucose demand is high, for example fasting, vomiting, intercurrent illness.
Imaging
In a 14-day-old neonate in our series no definite MRI abnormality was detected. In patients undergoing MRI examination during infancy or childhood, mild frontal atrophy and ventricular enlargement, bilateral basal ganglia and dentate nucleus and multiple patchy white matter lesions were described51. In the Saudi phenotype the white matter lesions appear to be predominantly periventricular32, whereas in cases reported from North America the lesions were found in both periventricular and subcortical12 or in exclusively subcortical location15.
FATTY ACID OXIDATION DISORDERS
This group includes carnitine cycle defects (carnitine–palmitoyle transferase deficiency, carnitine translocase deficiency), beta-oxidation disorders (very long-, medium-, and short-chain acyl coenzyme A dehydrogenase, as well as long- and short-chain 3-hydroxy-acyl coenzyme A dehydrogenase deficiencies) and electron transfer flavoprotein dehydrogenase deficiency (multiple acyl coenzyme A dehydrogenase deficiency, usually referred to as glutaric aciduria type 2).
Very long-chain acyl coenzyme A dehydrogenase, long-chain 3-hydroxy-acyl coenzyme A dehydrogenase and glutaric aciduria type 2 may be encountered in neonates, the others have only later onset, infantile or childhood forms.
Fatty acid oxidation disorders – because of the resultant impairment of the aerobic energy metabolism at the mitochondrial level – are characterized by multi-organ (heart, liver, muscles) involvement. Dysfunction of the mitochondria within the myocardium, where energy is partially derived from fat, results initially in conduction problems and subsequently in global cardiac failure. On the other hand, fatty acid overload leads to steathosis at the level of the liver.
Very long-chain acyl coenzyme A dehydrogenase and long-chain 3-hydroxy-acyl coenzyme A dehydrogenase deficiencies
Metabolic features
Neonates present with hyperammonemia, hypoglycemia, lactic acidosis and cardiac arrhythmia.
Clinical course
The condition is usually untreatable and leads to death, except the Scandinavian phenotypes, which are compatible with life.
Treatment
Aggressive treatment of hypoglycemia and avoidance of fasting. A high carbohydrate and low fat diet is used.
Imaging
No imaging data are available in very long-chain acyl coenzyme A dehydrogenase and long-chain 3-hydroxy-acyl coenzyme A dehydrogenase deficiencies.
Multiple acyl coenzyme A dehydrogenase deficiency (glutaric aciduria type 2)
Glutaric aciduria type 2 has two neonatal and one later-onset phenotypes. This needs to be distinguished from glutaric acidemia type 1, which is secondary to an isolated deficiency of glutaryl-CoA deficiency and presents in infancy.
Enzyme deficiency
This disease is caused by deficiency of the electron transfer flavoprotein failing to transport electrons to intramitochondrial dehydrogenase enzymes. It therefore also represents a profound mitochondrial metabolic–energetic disorder.
Metabolic features
Onset is characterized by metabolic acidosis, organic (glutaric, 2-hydroxyglutaric, isovaleric, isobutyric, ethylmalonic) aciduria and hypoglycemia without ketosis.
Clinical features
There is a high incidence of premature birth. The neonatal form may present with or without congenital malformations. These include hepatomegaly, enlarged kidneys, abnormal external genitalia, rocker bottom feet, defects of the anterior abdominal wall and neuronal migration defects in the brain. Onset of metabolic symptoms is usually between 24 and 48h of age with stupor, tachypnea, hypotonia and sometimes seizures. Hypotonia can be very marked and suggestive of a neuromuscular disorder.
Clinical course
Those infants presenting with associated congenital anomalies usually die within the first few weeks of life. Patients with the other neonatal phenotype develop progressive cardiomyopathy and die by the age of 1 year.
Treatment
Restricted fat and protein diet with riboflavin and carnitine supplementation has been generally unsuccessful. Treatment may need to be started antenatally.
Imaging
In a case report of the neonatal form, underdeveloped frontal and temporal lobes with enlarged Sylvian fissures (somewhat similar to glutaric aciduria type 1), delayed myelination and hypoplasia of the corpus callosum have been described at the age of 14 weeks39.
Spectroscopy
Normal NAA, increased lactate were described in glutaric aciduria type 2, in conjunction with increased Cho/Cr ratio, interpreted as a sign of dysmyelination39.
OTHER ORGANIC ACID DISORDERS
Pyroglutamic aciduria (5-oxoprolinuria)
Enzyme deficiency
In the classical form the underlying enzyme abnormality is glutathione synthetase deficiency.
Inheritance
Autosomal recessive.
Genetics
The encoding gene is located on chromosome 20.
Metabolic features
Acidosis without ketosis or lactic acidosis. The unavailability of glutathione causes membrane fragility of the erythrocytes presenting with hemolytic anemia and jaundice. The resultant hemolytic–acidotic crisis may be seen both in neonates and infants. It is, however, noteworthy that transient or constant 5-oxoprolinuria is a non-specific laboratory finding and can occur without defect in the gamma-glutamyl cycle (e.g. in GM2 gangliosidosis, urea cycle defects, tyrosinemia type 1, methylmalonic and propionic acidemias)27.
Clinical features
Approximately half of neonates exhibit neurological signs usually stupor or coma. The disease may also manifest with a slowly progressive encephalopathy later in childhood.
Treatment
Therapy with glucose and sodium bicarbonate is vital acutely. Infants may remain well between intermittent episodes of acidosis.
Sulfite oxidase deficiency
This may occur as an isolated enzyme defect or in combination with xanthine dehydrogenase deficiency as part of molybdenum co-factor deficiency. Molybdenum co-factor is essential for the action of both enzymes.
Metabolic features
Sulfite, S-sulfocysteine, taurine and xanthine accumulate and are excreted in the urine. A sulfite strip test on fresh urine offers a useful screening test. Xanthine is found in molybdenum co-factor deficiency but not in isolated sulfite oxidase deficiency. Lactic acidosis may be present. Blood uric acid is depressed in the molybdenum co-factor deficiency form of the disease, the detection of hypouricemia is a valuable screening test.
Clinical features
Feeding difficulties, vomiting and seizures within the first few days.
Clinical course
Survivors develop spasticity, microcephaly and severe intellectual impairment. Seborrheic rash and dislocated lenses develop later in infancy.
Treatment
Dietary methionine restriction and cysteine supplementation has been tried, with one reported success.
Imaging
Studies show progressive destruction of cortex, basal ganglia, thalami, cerebellum and white matter. Cystic changes within the myelin may be found.
DISORDERS OF AMINO ACID METABOLISM
Maple syrup urine disease (MSUD, branched chain amino-acidemia)
Enzyme deficiency
Deficiency of the branched-chain alpha-ketoacid dehydrogenase enzyme (see earlier in abnormalities of the l-leucine breakdown pathway).
Inheritance
Autosomal recessive.
Genetics
The encoding genes of the three enzyme subunits are located on chromosomes 19 and 6 (E1 alpha and beta subunits), 1 (E2 subunit) and 7 (E3 subunit). It is noteworthy that the E3 subunits of the pyruvate dehydrogenase (see above in primary lactic acidosis), the alpha-ketoacid dehydrogenase (defective in alpha ketoglutaric aciduria, a metabolic disease with late infantile or childhood onset) and of the branched-chain alpha-ketoacid dehydrogenase are identical and encoded by the same gene (chromosome 7q31–q32) in prokaryotic cells.
Metabolic features
Owing to the underlying enzyme defect the metabolism of alpha ketoisocaproic, alpha keto-beta-methylvaleric and alpha-ketoisovaleric acids (intermediate metabolites in the breakdown of l-leucine, l-isoleucine and l-valine) is interrupted in MSUD. Biochemical effects of the marked elevation of branched-chain ketoacids and branched-chain amino acids in body fluids involve the metabolism of neurotransmitters and compounds important in energy metabolism (pyruvate and glucose) and the synthesis of proteins and myelin.
Clinical features
Four clinical phenotypes of MSUD have been identified. The classical form is the most severe, occurring in neonates. The intermediate and intermittent forms are usually of infantile or even later onset. The thiamine responsive form is encountered in all age groups. The classic variety presents at about 5–7 days after birth with poor feeding, vomiting, hypoglycemia, seizures, fluctuating ophthalmoplegia, coma and a characteristic odor of maple syrup.
Clinical course
Early diagnosis and an appropriate dietary regimen improve long-term outcome in patients with MSUD but intercurrent decompensation is a possible life-threatening complication.
Treatment
Diet that contains no or restricted branched-chain amino acids, according to blood levels.
Imaging
This disease presents with a highly characteristic, and practically pathognomonic MRI pattern if diffusion-weighted imaging is used in addition to the standard conventional sequences (see earlier section on diffusion-weighted MR imaging in neurometabolic disorders). Diffuse brain swelling is observed in the non-myelinated white matter secondary to vasogenic edema. Prolongation of the T2 relaxation time is seen within the cerebral white matter, more pronounced within the myelinated (due to vacuolating myelinopathy) than the non-myelinated (due to vasogenic edema) white matter (Fig. 17.4 and Fig. 17.15).

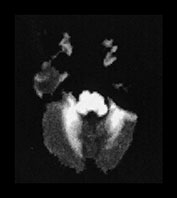
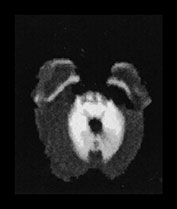


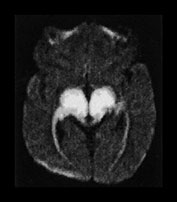


Fig. 17.15 Axial echo planar diffusion-weighted images (b = 1000, diffusion gradient in the slice selection direction) of the brain in MSUD (same patient as Fig. 17.4). Very prominent signal intensity is seen within the myelinated structures (compare with Fig. 17.4) consistent with isotropically restricted water diffusion. In contrast to the T2 weighted images, the non-myelinated white matter structures are hypointense with this technique, therefore vasogenic edema (characterized by increased water diffusion) is easily differentiated from vacuolating myelinopathy. At the same time an accurate myelination map of the newborn is also provided.
< prev | top | contents | next >
Spectroscopy
The protons of the methyl groups of the branched-chain amino acids resonate at 0.9–1.0ppm. In healthy subjects, with long echo time, there is no observable signal at 0.9–1.0ppm. However, in patients with MSUD with acute metabolic decompensation where plasma, CSF and cerebral levels of branched-chain amino acids and ketoacids are elevated, a peak at 0.9–1.0ppm may be detected using either short or long TE proton MR spectroscopy11 (Fig. 17.16). A possible associated elevated lactate peak at 1.3ppm reflects the impairment in energy metabolism and utilization of pyruvate in the citric acid cycle. These two peaks were seen to disappear on recovery11. The NAA peak may also be low during the acute decompensation and return to a higher level on recovery48.

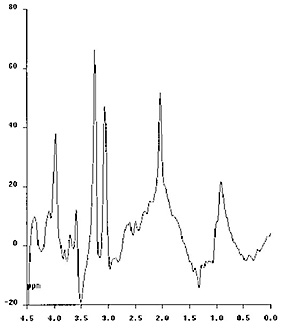
Fig. 17.16 Proton MR spectra obtained with the PRESS technique using 135ms echo time (a) and the STEAM technique using 20ms echo time (b) in a 1-month-old infant with MSUD. The sampling voxel (2 x 2 x 2cm) was placed on the basal ganglia. The first spectrum shows a decreased NAA peak and a small amount of lactate at the 1.3ppm level. On the second spectrum a rather prominent peak is seen at the 0.9–1.0ppm level, corresponding to branched-chain amino acids.
Non-ketotic hyperglycinemia
Enzyme deficiency
A defect of the glycine cleavage system. The glycine cleavage system is expressed in liver, kidney and the brain and its defect leads to an accumulation of glycine in body fluids. The defect of the glycine cleavage system in the brain and the resulting accumulation of glycine are thought to be critical in the neurotoxicity. There appear to be two neurotransmitter roles for glycine in the CNS – one inhibitory and one excitatory and these roles are influenced by maturation. The classic glycine receptor is inhibitory and located in the spinal cord and brain stem. The second glycine receptor site is associated with the N-methyl-d-aspartate (NMDA)-receptor channel complex. Glycine acting at this site is excitatory and potentiates the action of glutamate, leading to glutamate-induced excitotoxic neuronal death.
Inheritance
Autosomal recessive.
Metabolic features
Marked accumulation of glycine in blood, urine and CSF occurs; the latter being particularly characteristic. Diagnosis is made with the ratio of the concentration of glycine in the CSF to that in the plasma and ranges from 0.1 to 0.3 (control values approximately 0.02).
Clinical features
Non-ketotic hyperglycinemia has four known clinical phenotypes: neonatal, infantile, late-onset and transient. The neonatal form (often referred to as classical, the others as atypical) is far the most common. The neonatal form of non-ketotic hyperglycinemia presents within the first 2 days of life with encephalopathy, lethargy, breathing difficulties leading to respiratory failure, multifocal myoclonic seizures (showing burst suppression pattern on the EEG) and quite characteristically with hiccups23. The pronounced hypotonia may be related to the inhibitory effect of glycine on anterior horn cells within the spinal cord.
Clinical course
Most children die in the first year of life while others display severe neurodevelopmental delay but may survive for many years.
Treatment
The disease is usually resistant to treatment.
Imaging
Diffuse cerebral atrophy, callosal hypotrophy and disturbed/delayed myelination constitute the imaging hallmarks of non-ketotic hyperglycinemia33. Assessment of the corpus callosum is difficult in the neonate, due to its small size and lack of myelin, but the underdevelopment of the corpus callosum becomes evident later. Occasionally, a true malformation (agenesis, dysgenesis) may also be encountered50 (Fig. 17.2 and Fig. 17.17).
Atrophy of the brain may already be present in the neonate but continues to progress. In surviving patients, delay in the myelination process becomes increasingly conspicuous with age. Supratentorial structures appear to be predominantly involved; the brain stem and cerebellar structures may be relatively but not totally spared. Atrophy and delayed myelination are also quite common findings in other metabolic disorders, in particular in organic acidurias. Proton MR spectroscopy, however, by directly demonstrating abnormal amount of glycine within the brain parenchyma, provides specific diagnostic information (see below).


Fig. 17.17 Sagittal T1 weighted spin echo images in an 8-month-old infant with non-ketotic hyperglycinemia. The anterior components (genu and the anterior part of the body) are markedly hypotrophic but recognizable consistent with partial dysgenesis.
Spectroscopy
Proton MR spectroscopy of the brain at long echo times (e.g. TE = 135ms) allows the non-invasive, direct demonstration of glycine in infants with non-ketotic hyperglycinemia. This signal at 3.56ppm generated by the protons of glycine overlaps with the in vivo myo-inositol signal at short (e.g. 20ms) echo times (glycine accounts for less than 20% of the 3.56ppm signal in normal subjects). However, as the signal from myo-inositol significantly decays at longer echo times, a prominent ‘residual’ signal on a second sampling at a long echo time allows their reliable differentiation (Fig. 17.18).
Cerebral concentrations of glycine seem to correspond more reliably to clinical findings than CSF and plasma levels20. Serial proton MR spectroscopy studies have been found to be useful in following the therapeutic response to drugs aimed at reducing glycine in the CNS (e.g. sodium benzoate and dextromethorphan which have been shown to have beneficial effects in some infants with non-ketotic hyperglycinemia)18, 20.
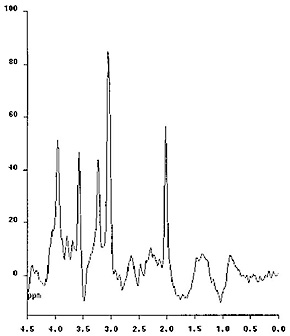

Fig. 17.18 Proton MR spectra obtained with the STEAM technique using 20ms echo time (a) and the PRESS technique using 135ms echo time (b) in a 9-month-old infant with non-ketotic hyperglycinemia. The sampling voxel (2 x 2 x 3cm) was placed on the basal ganglia. The NAA and choline peaks are decreased. myo-Inositol and glycine are known to overlap at the 3.55ppm level when short echo times are used (a). Using long echo times the myo-inositol peak disappears, whereas glycine, which has a longer T2 relaxation time, remains apparent, if present in abnormal amount. In this case the persistent peak indicates that it mostly corresponds to glycine (b).
< prev | top | contents | next >
UREA CYCLE DEFECTS
The urea cycle is involved in the synthesis of arginine and the elimination of excess nitrogen through the formation of urea.
Enzyme deficiencies
The involved enzymes are the carbamylphosphatase synthetase, ornithine transcarbamylase, argininase (hyperargininemia), argininosuccinic acid lyase (argininosuccinic aciduria) and argininosuccinic acid synthetase (citrullinemia). The carbamylphosphatase synthetase and the ornithine transcarbamylase are mitochondrial enzymes, the others are found within the cytosol.
Inheritance
Ornithine transcarbamylase deficiency has an X-linked recessive inheritance; the other diseases are autosomal recessive.
Metabolic features
Impairment of the urea cycle has significant consequences:
(1) Arginine becomes an essential amino acid (except in hyperargininemia).
(2) Severe hyperammonemia develops. Besides its direct toxic effect, it also leads to disequilibrium between the excitatory (glutamate) and inhibitory (gamma amino butyric acid (GABA)) neurotransmitters through stimulation of glutamate synthesis from glutamine and ammonia at the presynaptic level. Although the exact mechanism of the resultant damage to neurons (‘glutamate suicide’) is still poorly understood, this is felt to be one of the major factors behind the devastating effects on the brain parenchyma in urea cycle defects and in some of the organic acidurias, for example glutaric aciduria type 1.
Besides hyperammonemia, in urea cycle defects aminoacidemia and respiratory alkalosis are also typically seen.
Clinical features
Ornithine transcarbamylase deficiency, carbamylphosphatase deficiency and citrullinemia are the most frequent forms to occur in neonates. Argininosuccinic aciduria usually has a few days later onset, whereas in hyperargininemia the typical presentation is slowly progressive encephalopathy. In the neonatal forms of urea cycle defects hyperammonemia leads to diffuse brain edema responsible for the signs of raised intracranial pressure at physical and neurological examination (hypotonia, vomiting, hypothermia, seizures, bulging fontanel, rapidly increasing head circumference). Hyperventilation results in the distinctly characteristic respiratory alkalosis.
Clinical course
Over half the infants die in the neonatal period. The majority of survivors show neurodevelopmental impairment.
Treatment
Immediate postnatal diagnosis and treatment of urea cycle defects is of utmost importance, since delay in appropriate management leads to death or severe and irreversible neurological deficit. Emergency procedures to reduce ammonia levels are followed by a low protein diet. Abundant non-protein calories and essential amino acids are required to reduce protein catabolism. The most encouraging results of appropriate short- and long-term treatment occur in infants with carbamylphosphatase synthetase deficiency.
Imaging
The most prominent MRI imaging finding in all neonatal forms of the urea cycle defects (carbamylphosphatase synthetase, ornithine transcarbamylase, citrullinemia, argininosuccinic aciduria) is the diffuse and marked brain edema. Analysis of the T2 weighted images reveals prominent signal changes within the non-myelinated white matter with relative preservation of the myelinated areas (Fig. 17.19). This is in clear contrast with MSUD, where signal changes predominate in the myelinated white matter. The underlying pathophysiological mechanism in urea cycle defects (vasogenic edema) is different from that in MSUD (vacuolating myelinopathy), as demonstrated by the distinctly different presentations on diffusion-weighted images. Gray matter structures, the basal ganglia and cortex may also be involved in the most severe cases.
The conventional MRI findings may be very similar to some of the organic acidurias; however, by proton MR spectroscopy they can be easily differentiated (see below).


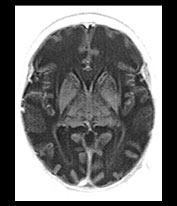

Fig. 17.19 Axial fast inversion recovery images in a 12-day-old neonate with carbamylphosphatase synthetase deficiency. Prominent diffuse brain edema is seen in conjunction with marked T1 prolongation predominantly in the non-myelinated white matter structures.
Spectroscopy
Increase in glutamate and glutamine and a decrease in myo-inositol (mI) is typical, although non-specific findings in urea cycle defects using proton MR spectroscopy8, 47 (Fig. 17.20). Glutamine is usually easier to demonstrate with short echo time (20ms), but high concentrations may be detectable at longer echo times (135ms), too. Additional abnormal proton MR spectroscopic findings include decrease of NAA, choline and creatinine. Since similar changes occur in hepatic encephalopathy, these abnormalities are non-specific, but in the given clinical setting and when interpreted together with conventional imaging findings, they can be highly suggestive.

Fig. 17.20 Proton MR spectrum obtained with the PRESS sequence using 135ms echo time in a 12-day-old newborn with urea cycle defect (same patient as Fig. 17.19). The sampling voxel (2 x 2 x 1cm) is placed on the basal ganglia. Prominent decrease of the NAA peak is seen in conjunction with increased glutamine–glutamate peaks both at the 2.3ppm and the 3.8ppm levels. Abnormal amount of lactate is also suggested at the 1.3ppm level.
< prev | top | contents | next >
PEROXISOMAL DISORDERS IN THE NEONATE
Peroxisomes are cellular organelles. Peroxisomal enzymes are involved in multiple metabolic pathways, including lipid metabolism. They are therefore indispensable in the normal myelination process. For this reason, peroxisomes are particularly abundant in oligodendrocytes in neonates and infants. Peroxisomal diseases typically present with involvement of the central nervous system with predilection of the white matter (hypo-, dys- and demyelination).
Peroxisomal diseases represent a continuum. Those caused by total absence of peroxisomal activity (peroxisomal biogenesis disorders) are characterized by neonatal or early infantile onset and represent the most severe forms. The resultant disease entities, such as Zellweger’s syndrome and neonatal adrenoleukodystrophy, present with immediate postnatal onset of clinical signs and symptoms. These are generalized systemic diseases, in which involvement of the central nervous system is always severe but not exclusive. The infants present in the neonatal period with hypotonia, difficulty in sucking and swallowing requiring gavage feeding, myoclonic seizures, abnormal vision and abnormal facies. They typically lead to death within the first few months or years of life. Other forms with multiple peroxisomal dysfunctions are characterized by infantile or childhood-onset (pseudo-infantile Refsum disease, Zellweger-like syndrome) and the disease course is more prolonged.
If the metabolic abnormality is limited to the loss of a single peroxisomal function only (e.g. metabolism of phytanic acid in Refsum disease or degradation of very long-chain fatty acids in X-linked adrenoleukodystrophy (X-ALD)) the resultant disease may be of childhood, juvenile or adult onset. Some of them may be compatible with life (adrenomyeloneuropathy, Refsum disease); others (X-ALD) are not.
Zellweger (cerebrohepatorenal) syndrome
Enzyme deficiency
There is a lack of biogenesis of the peroxisomes, therefore practically all peroxisomal functions are absent. This is the most severe of all the peroxisomal diseases.
Inheritance
Autosomal recessive.
Metabolic features
Elevated very long-chain fatty acids in the plasma and fibroblasts, impairment of plasmalogen biosynthesis and abnormal patterns of bile acids.
Clinical features
Besides the rather typical facial dysmorphic features, the most severe abnormalities are seen at the level of the brain (cortical dysplasia and hypomyelination), liver and kidneys.
Clinical course
Infants with Zellweger disease fail to thrive and usually die before the age of 1 year.
Imaging
Conventional MRI findings alone are pathognomonic in this disease. Diffuse, markedly delayed myelination is easily appreciated in both the inversion recovery and the T2 weighted images. Careful analysis of the cortical ribbon in the temporo-parietal regions reveals extensive areas of polymicrogyria-like changes. These abnormalities are often easier to identify on the T2 than the T1 weighted images. The use of high-resolution matrix significantly enhances their conspicuity (Fig. 17.21). Subependymal, so-called germinolytic cysts are occasionally present along the frontal horns of the lateral ventricles36. Incomplete opercularization, verticalization of the Sylvian fissures, colpocephaly28, cerebellar cortical dysplasia, hypo- or dysplasia of the inferior olives have been also described in this disease. The presence of both white and gray matter abnormalities as well as dysmorphic–dysplastic changes of the brain are in keeping with a profound metabolic abnormality with early intrauterine onset. Additional imaging work-up shows calcification within the patella and acetabulum (plain X-ray) and cysts within the kidneys (ultrasound, CT)49.
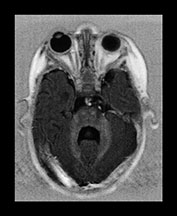


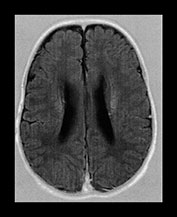


Fig. 17.21 Axial fast inversion recovery (a–d) and T2 weighted fast spin echo (e–h) images in a 5-month-old female infant with Zellweger syndrome. Delayed myelination is evident on both the T1 and the T2 weighted images. Cortical dysplasia bilaterally in the temporo-parietal regions is more conspicuous on the T2 (g–h) than on the T1 weighted (c–d) images.
Spectroscopy
A study comparing four infants with variants of Zellweger syndrome with normal controls, demonstrated a marked decrease in NAA in white and gray matter, thalamus and cerebellum. In two cases an increase in cerebral glutamine and a decrease in myo-inositol in the gray matter reflecting the concomitant effect on hepatic function were seen. Two severe cases also demonstrated an increase in mobile lipids in the white matter. A slight increase in lactate levels was seen. These findings are not specific to peroxisomal disorders but give insight into the metabolic effects on the developing brain (Fig. 17.22).
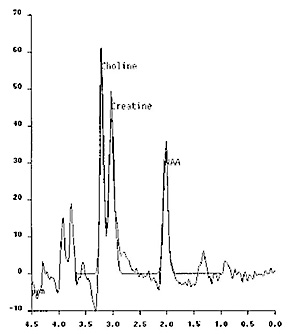
Fig. 17.22 Proton MR spectrum obtained with the PRESS sequence using 270ms echo time in a 5-month-old female infant with Zellweger syndrome. The sampling voxel (2 x 2 x 2cm) is placed on the basal ganglia. The NAA peak is markedly decreased, the glutamine–glutamate peak at the 3.8ppm level is increased and a small amount of lactate is also detected at the 1.3ppm level.


Fig. 17.22 Proton MR spectrum obtained with the PRESS sequence using 270ms echo time in a 5-month-old female infant with Zellweger syndrome. The sampling voxel (2 x 2 x 2cm) is placed on the basal ganglia. The NAA peak is markedly decreased, the glutamine–glutamate peak at the 3.8ppm level is increased and a small amount of lactate is also detected at the 1.3ppm level.
Neonatal adrenoleukodystrophy
Metabolic features
Typical laboratory findings include increased plasma pipecolic, phytanic acid and very long-chain fatty acid levels and lead to the correct diagnosis despite the non-specific clinical presentation.
Clinical features
These children do not have dysmorphic features or skeletal abnormalities but involvement of the central nervous system is already apparent at birth by the presence of severe hypotonia, hearing loss, retinal degeneration and seizures.
Imaging
Imaging findings are compatible with dys- and/or demyelination within the cerebellar and cerebral white matter (Fig. 17.23) (see Chapter 14). Signs of a neuronal migration disorder may also be conspicuous. The presence of contrast uptake in the involved areas described on CT images suggests an active, perhaps inflammatory process, similar to that seen within the active inflammation zone in X-linked adrenoleukodystrophy45.
Rhizomelic chondrodysplasia punctata
Enzyme deficiency
Multiple but not all peroxisomal functions are absent.
Inheritance
Autosomal recessive.
Clinical features
Dysmorphic features are evident at birth. Shortening of the proximal parts of the extremities is the most characteristic physical examination finding. Severe psychomotor delay, failure to thrive, ichthyosis and cataract complete the clinical syndrome.
Imaging
Besides the straightforward abnormalities of the extremities, plain X-ray examination reveals more profound skeletal abnormalities, including calcifications within the epiphyseal cartilage, metaphyseal cupping and coronal clefts in the vertebral bodies. MRI findings suggest a combination of delayed and dysmyelination44.
Menkes disease (kinky/steely hair disease, trichopoliodystrophy)
Menkes disease is a metal metabolism disorder due to a defect in intracellular–intercompartmental copper transport (in contrast to Wilson’s disease which represents an extracellular copper transport abnormality).
Enzyme deficiency
Several enzymes which require copper as a co-factor are deficient, the most important of which are those involved in catecholamine synthesis (dopamine-beta-hydroxylase), oxidative phosphorylation (cytochrome c oxidase) and elastin–collagen formation (lysyl oxidase).
Inheritance
X-linked.
Clinical features
The disease has neonatal and infantile-onset forms. Impairment of catecholamine (neurotransmitter) synthesis and oxidative phosphorylation may explain the neurological manifestations (hypotonia, seizures) of the disease, whereas the elastin–collagen formation disorder possibly causes intimal fragility and the characteristic tortuous elongated appearance of cerebral arteries. The typical hair abnormalities may not be apparent in the newborn.
Imaging
MRI studies during the early postnatal period usually do not reveal significant abnormalities. Subtle signal abnormalities within the cerebral cortex may be seen, the pathological significance of which is unclear3, 21. Later scans show progressive white matter disease with frontal and temporal predominance7 and prominent cerebral and cerebellar atrophy. MR angiography was found to be useful in the demonstration of the characteristic tortuosity of the cerebral vessels21. In a patient treated with copper histidinate no cerebral atrophy or white matter abnormalities were seen, tortuosity of the cerebral arteries was however still conspicuous1. Patients with Menkes disease are prone to ‘spontaneous’, most probably ‘ex vacuo’ developing subdural hematomas which should not be misdiagnosed as a sign of child abuse.
< prev | top | contents | next >
Clinical management of inborn errors of metabolism in neonates
PRENATAL MANAGEMENT
Prenatal diagnosis is possible in many of the neurometabolic disorders, including propionic acidemia, Menkes disease, peroxisomal diseases, urea cycle defects and disorders of oxidative phosphorylation by demonstration of deficient enzyme activity in cultured amniocytes and chorionic villous samples and/or of abnormal metabolites in amniotic fluid.
Emerging new techniques, allowing for pre-implantation diagnosis by direct identification of gene and chromosome abnormalities or sex determination (in families with high risk for X-linked genetic disorders), represent new promising options in the prenatal management of inborn errors of metabolism.
In one case, prenatal ultrasound has been reported to be diagnostic in rhizomelic chondrodystrophia punctata by demonstrating the characteristic skeletal abnormalities37. Imaging techniques, however, have not been used systematically in the prenatal diagnosis of inborn errors of metabolism. With the increasing use of fast (HASTE – half-Fourier single shot turbo spin echo) intrauterine MRI imaging this may change and diseases presenting with malformations or morphological abnormalities of the brain (Zellweger syndrome, glutaric aciduria type 1) may be depicted.
POSTNATAL MANAGEMENT
Imaging work-up is an integral part of the postnatal management process. In this respect ultrasound and CT have a definite role as well, especially in ruling out other pathologies, such as hydrocephalus in neonates with progressive increase of head size and intracerebral bleeding in neonates with lethargy or coma. Ultrasound has been found to be useful in the demonstration of morphological changes suggestive of neurometabolic disease (e.g. bilateral Sylvian fissure abnormalities in glutaric aciduria type 1 or germinolytic cysts in Zellweger syndrome)13, 36.
Many of the neonatal metabolic disorders present with non-specific MRI findings during the early postnatal period. The characteristic imaging findings (basal ganglia disease, dys- or delayed myelination, white matter disease) may develop at a later stage. Therefore, in the case of non-conclusive initial work-up, follow-up MR examinations may be helpful.
Non-invasive monitoring of the effects of therapeutic measures by conventional MR imaging (e.g. progress of myelination) or MR spectroscopy (e.g. decrease of the brain concentration of abnormal substances) is another important indication of follow-up studies8, 20, 25.
< prev | top | contents | next >
Conclusion
Management of neonates with metabolic disorders requires a multidisciplinary approach and close collaboration of obstetricians, pediatricians, geneticists, biochemists and radiologists. The age of onset, the presence or absence of dysmorphic features, skin manifestations, laboratory changes, neurological signs and symptoms, visceral and musculoskeletal abnormalities, MRI and spectroscopic alterations are all potentially important clues in the diagnostic work-up. Metabolic diseases may present with confusingly similar or distinctly different clinical, biochemical and imaging abnormalities, each of them representing a ‘fingerprint’ or ‘pattern’ of the disease, some of which may be therefore non-specific, others characteristic, suggestive or even pathognomonic22, 46. The set of these ‘stigmata’ describes the clinical–radiological pattern, which is a function of the varying susceptibility and vulnerability of the various organ systems to the different metabolic abnormalities. Recognition of the clinical and imaging substrates of selective vulnerability leads to clinical–radiological pattern recognition, the single most important concept that needs to be systematically applied in the diagnostic management of inborn errors of metabolism.
MRI is the most valuable modality in the imaging assessment of the central nervous system manifestations of inborn errors of metabolism, due to its inherently exquisite sensitivity to demonstrate lesions in the cerebral parenchyma. Awareness and recognition of the most characteristic imaging and spectroscopic patterns (e.g. urea cycle defects, peroxisomal disorders, propionic acidemia, non-ketotic hyperglycinemia, MSUD) is important, especially in centers which have sparse clinical experience with metabolic disorders, and where the diagnostic burden is heavier on the radiologist.
< prev | top | contents | next >
Summary
- The age of onset is an important diagnostic and prognostic factor in the inborn errors of metabolism. It can be prenatal, neonatal, infantile, childhood, adolescent or later. As a general rule, the earlier the onset, the more profound the metabolic disorder.
- Most inborn errors of metabolism of neonatal onset fall into the category of devastating metabolic diseases with potentially severe systemic or neurological sequelae.
- MRI is the technique of choice in the imaging evaluation of metabolic disorders. Plain X-ray, CT and ultrasound may occasionally provide complimentary information.
- Conventional MRI of the brain in neonatal metabolic disorders usually shows non-specific abnormalities (brain swelling, atrophy, delayed or hypomyelination).
- More rarely, specific morphological changes (e.g. callosal, cortical abnormalities) or parenchymal lesion patterns (i.e. the imaging manifestations of selective vulnerability) may be identified.
- The complex MR evaluation of inborn errors of metabolism includes diffusion-weighted imaging and proton MR spectroscopy. These techniques may enhance the diagnostic sensitivity and specificity of the MRI work-up.
- Many metabolic disorders present with characteristic or specific clinical abnormalities, which together with the MRI and spectroscopic findings may delineate a suggestive or pathognomonic clinical–radiological pattern.
- The definite diagnosis of inborn errors of metabolism usually relies on laboratory tests.
- The diagnosis and therapeutic management of metabolic disease requires a multidisciplinary approach.
< prev | top | contents | next >
Acknowledgements
The authors acknowledge and thank the support, guidance and stimulating collaboration of Mohammed Al-Essa MD, Zuheir Al-Rahbeeni MD, Jehad Al-Watban MD, Enrique Chaves-Carballo MD, Sarwat Hussain MD, Pinar Ozand MD PhD, Jaap Valk MD PhD and Mary Rutherford before and during the preparation of this chapter. Special credit is given to Ghadheer Al-Thali, Jennifer Bryant, Christine Corcoran, Helen McQuillan, Abdullah Balfagieh, Craig Briggs and Edgardo Martinez for performing the MR studies and their help in putting together the photographic material and to Vivienne Kynoch for scientific secretarial assistance.
< prev | top | contents | next >
References
- al Aqeel A, Rashed M, Ozand PT et al. (1994) 3-methylglutaconic aciduria: ten new cases with a possible new phenotype. Brain Dev 16 (Suppl), 23–32.
- Barker PB, Bryan RN, Kumar AJ et al. (1992) Proton NMR spectroscopy of Canavan’s disease. Neuropediatrics 23, 263–267.
- Barkovich AJ, Good WV, Koch TK et al. (1993) Mitochondrial disorders: analysis of their clinical and imaging characteristics. Am J Neuroradiol 14, 1119–1137.
- Barth PG, Scholte HR, Berden JA et al. (1983) An X-linked mitochondrial disease affecting cardiac muscle, skeletal muscle and neutrophil leukocytes. J Neurol Sci 62, 327–355.
- Beaulieu C, D’Arceuil H, Hedehus M et al. (1999) Diffusion-weighted magnetic resonance imaging: theory and potential applications to child neurology. Seminars in Pediatric Neurology 6, 87–100.
- Bergman AJIW, van der Knaap MS, Smeitnink JAM et al. (1996) Magnetic resonance imaging and spectroscopy of the brain in propionic acidemia: clinical and biochemical considerations. Pediatr Res 40, 404–409.
- Blaser SI, Berns DH, Ross JS et al. (1989) Serial MR studies in Menkes disease. J Comput Assist Tomogr 13, 113–115.
- Connelly A, Cross JH, Gadian G et al. (1993) Magnetic resonance spectroscopy shows increased brain glutamine in ornithine carbamoyl transferase deficiency. Pediatr Res 33, 77–81.
- Detre JA, Wang Z, Bogdan AR et al. (1991) Regional variation in brain lactate in Leigh syndrome by localized 1H magnetic resonance spectroscopy. Ann Neurol 29, 218–221.
- Ebisu T, Naruse S, Horikawa Y et al. (1993) Discrimination between different types of white matter edema with diffusion-weighted MR imaging. JMRI 3, 863–868.
- Felber SR, Sperl W, Chemelli A et al. (1993) Maple syrup urine disease: metabolic decompensation monitored by proton magnetic resonance imaging and spectroscopy. Ann Neurol 33, 396–401.
- Ferris NJ and Tien RD (1993) Cerebral MRI in 3-hydroxy-3-methylglutaryl-coenzyme A lyase deficiency: case report. Neuroradiology 35, 559–560.
- Forstner R, Hoffmann GF, Gassner I et al. (1999) Glutaric aciduria type 1: ultrasonographic demonstration of early signs. Pediatr Radiol 29, 138–143.
- Gibson KM, Breuer J, Kaiser K et al. (1988) 3-hydroxy-3-methylglutaryl-coenzyme A lyase deficiency: report of five new patients. J Inher Metab Dis 11, 76–87.
- Gordon K, Riding M, Camfield P et al. (1994) CT and MR of 3-hydroxy-3-methylglutaryl-coenzyme A lyase deficiency. Am J Neuroradiol 15, 1474–1476.
- Grodd W, Krageloh-Mann I, Klose U et al. (1991) Metabolic and destructive brain disorders in children: findings with localized proton MR spectroscopy. Radiology 181, 173–181.
- Grodd W, Krageloh-Mann I, Petersen D et al. (1990) In vivo assessment of N-acetylaspartate in brain in spongy degeneration (Canavan’s disease) by proton spectroscopy. Lancet 336, 437–438.
- Hamosh A, Maher JF, Bellus GA et al. (1998) Long-term use of high-dose benzoate and dextromethorphan for the treatment of nonketotic hyperglycinemia. J Pediatr 132, 709–713.
- Heindel W, Kugel H, Herholz K (1999) H-1 MRS and 18-FDG-PET in children with congenital lactic acidosis. Proc Intl Soc Magn Reson Med (Abstract).
- Heindel W, Kugel H and Roth B (1993) Noninvasive detection of increased glycine content by proton MR spectroscopy in the brains of two infants with nonketotic hyperglycinemia. Am J Neuroradiol 14, 629–635.
- Jacobs DS, Smith AS, Finelli DA et al. (1993) Menkes kinky hair disease: characteristic MR angiographic findings. Am J Neuroradiol 14, 1160–1163.
- Kohlschlütter A (1994) Neuroradiological and neurophysiological indices for neurometabolic disorders. Eur J Pediatr 153(Suppl 1), S90–S93.
- Lu FL, Wang PJ, Hwu WL et al. (1999) Neonatal type of non-ketotic hyperglycinemia. Pediatr Neurol 20, 295–300.
- Marks HG, Caro PA, Wang ZY et al. (1991) Use of computed tomography, magnetic resonance imaging, and localized 1H magnetic resonance spectroscopy in Canavan’s disease: a case report. Ann Neurol 30, 106–110.
- Martinez M and Vazquez E (1998) MRI evidence that docosahexaenoic acid ethyl ester improves myelination in generalized peroxisomal disorders. Neurology 51, 26–32.
- Marzan KAB and Barron TF (1994) MRI abnormalities in Behr syndrome. Pediatr Neurol 10, 247–248.
- Mayatepek E (1999) 5-oxoprolinuria in patients with and without defects in the g-glutamyl cycle. Eur J Pediatr 158, 221–225.
- Nakada Y, Hyakuna N, Suzuki Y et al. (1993) A case of pseudo-Zellweger syndrome with a possible bifunctional enzyme deficiency but detectable enzyme protein. Comparison of two cases of Zellweger syndrome. Brain Dev 15, 453–456.
- Nomura Y, Sakuma H, Takeda K et al. (1994) Diffusional anisotropy of the human brain assessed with diffusion-weighted MR: relation with normal brain development and aging. Am J Neuroradiol 15, 231–238.
- Oberholzer VG, Levin B, Burgess EA et al. (1967) Methylmalonic aciduria. An inborn error of metabolism leading to chronic metabolic acidosis. Arch Dis Child 42, 492–504.
- Ono J, Harada K, Sakurai K et al. (1997) Differentiation of dys- and demyelination using diffusional anisotropy. Pediat Neurol 16, 63–66.
- Ozand PT, Aqeel A, Gascon G et al. (1991) 3-Hydroxy-3-methylglutaryl-coenzyme A (HMG-CoA) lyase deficiency in Saudi Arabia. J Inher Metab Dis 14, 174–188.
- Press GA, Barshop BA, Haas RH et al. (1989) Abnormalities of the brain in nonketotic hyperglycinemia: MR manifestations. Am J Neuroradiol 10, 315–321.
- Rashed MS, Bucknall MP, Little D et al. (1997) Screening blood spots for inborn errors of metabolism by electrospray tandem mass spectrometry with a microplate batch process and a computer algorithm for automated flagging of abnormal profiles. Clin Chem 43, 1129–1141.
- Rashed MS, Ozand PT, Bucknall MP et al. (1995) Diagnosis of inborn errors of metabolism from blood spots by acylcarnitines and amino acids profiling using automated electrospray tandem mass spectrometry. Pediatr Res 38, 324–331.
- Russel IM, van Sonderen L, van Straaten HLM et al. (1995) Subependymal germinolytic cysts in Zellweger syndrome. Pediatr Radiol 25, 254–255.
- Sastrowijoto SH, Vandenberghe K, Moerman P et al. (1994) Prenatal ultrasound diagnosis of rhizomelic chondrodysplasia punctata in a primigravida. Prenatal Diag 14, 770–776.
- Schulze A, Hess T, Wevers R et al. (1997) Creatine deficiency syndrome caused by guanidinoacetate methyltransferase deficiency: diagnostic tools for a new inborn error of metabolism. J Pediatr 131, 626–631.
- Shevell MI, Didomenicantonio G, Sylvian M et al. (1994) Glutaric acidemia type II: neuroimaging and spectroscopy evidence for developmental encephalopathy. Pediatr Neurol 12, 350–353.
- Stöckler S, Holzbach U, Hanefeld F et al. (1994) Creatine deficiency in the brain: a new, treatable inborn error of metabolism. Pediatr Res 36, 409–413.
- Takahashi S, Oki J, Miyamoto A et al. (1999) Proton magnetic resonance spectroscopy to study the metabolic changes in the brain of a patient with Leigh syndrome. Brain Dev 21, 200–204.
- Takeda K, Nomura Y, Sakuma H et al. (1997) MR assessment of normal brain development in neonates and infants: comparative study of T1- and diffusion-weighted images. J Comput Assist Tomogr 21, 1–7.
- van der Knaap MS, Barth PG, Vrensen GFJM et al. (1996) Histopathology of an infantile-onset spongiform leukoencephalopathy with a discrepantly mild clinical course. Acta Neuropathol 92, 206–212.
- van der Knaap MS and Valk J (1991) The MR spectrum of peroxisomal disorders. Neuroradiology 33, 30–37.
- van der Knaap MS and Valk J (1995) Zellweger cerebrohepatorenal syndrome, neonatal adrenoleukodystrophy. In: van der Knaap MS and Valk J (Eds) Magnetic Resonance of Myelin, Myelination and Myelination Disorders. Berlin, Springer, pp. 119–120.
- van der Knaap MS, Valk J, de Neeling N et al. (1991) Pattern recognition in magnetic resonance imaging of white matter disorders in children and young adults. Neuroradiology 33, 478–493.
- Vion-Dury J, Salvan AM, Confort-Gouny S et al. (1998) Atlas of brain proton magnetic resonance spectra. Part II: Inherited metabolic encephalopathies. J Neuroradiol 25, 281–289.
- Wang Z, Zimmerman RA and Sauter R (1996) Proton MR spectroscopy of the brain: clinically useful information obtained in assessing CNS disease in children. AJR 167, 191–199.
- Weese-Mayer DE, Smith KM, Reddy JK et al. (1987) Computerized tomography and ultrasound in the diagnosis of cerebro-hepato-renal syndrome of Zellweger. Pediatr Radiol 17, 170–172.
- Weinstein SL and Novotny EJ (1987) Neonatal metabolic disorders masquerading as structural central nervous system abnormalities. Ann Neurol 22, 406(Abstract).
- Yalcinkaya C, Dincer A, Gündüz E et al. (1999) MRI and MRS in HMG-CoA lyase deficiency. Pediatr Neurol 20, 375–380.