Hemorrhagic lesions of the
newborn brain
Mary A Rutherford
Chapter Contents
- MRI appearances of hemorrhage
- Etiology
- Sites of hemorrhage
- Extracranial hemorrhage
- Subdural hemorrhage
- Subarachnoid hemorrhage
- Thrombosis of sagittal sinus
- Parenchymal hemorrhage
- Arterio-venous malformations
- Thalamic hemorrhage
- Basal ganglia hemorrhage
- Cerebellar hemorrhage
- Intraventricular hemorrhage
- Complications of GLH IVH
- Ventricular dilation
- Summary
- References
MRI appearances of hemorrhage
The MRI appearances of blood are dependent on the oxidation state of hemoglobin and its environment. The appearances of hemorrhage vary with time in adult patients allowing the lesion to be aged (Table 9.1) but imaging studies on the evolution of hemorrhagic lesions in neonates are limited22. The signal intensity of a hemorrhagic lesion also depends on the field strength of the magnet and the sequence used to obtain the image; as a rule the evolution of hemorrhage appears faster at lower field strengths.
In our experience the evolution of cerebral hemorrhage in the immature brain is similar to that in the adult, although we have relatively few examples of perinatally acquired parenchymal hemorrhage before 3 days of age. The evolution of small parenchymal hemorrhagic lesions is not so typical as they may not show a persistent long T2 component. Table 9.2 and Table 9.3 summarize our serially acquired MRI findings in 49 infants with perinatal hemorrhage in one or more sites of the brain. Twenty-nine of these infants were term (105 sets of images) and 15 were preterm 23–36 weeks’ gestation (49 sets of images).
Extracerebral hemorrhage appears to behave slightly differently from parenchymal hemorrhage. Large intraventricular hemorrhages with clot within the ventricular system may have a long T2 component seen between 3 days and 3 weeks but this is not seen in smaller hemorrhages. Similarly, extracerebral hemorrhage generally only has a long T2 component if large. The experience in older infants with non-accidental injury is different again and may be related to the larger size of lesions or possibly to the presence of repeated injury (see Chapter 13). Parenchymal hemorrhages in the neonate behave slightly differently depending on their size and this may reflect different etiology. In our experience smaller hemorrhages within the parenchyma are easier to see on T1 weighted images than on conventional T2 weighted images (Fig. 9.3 and Fig. 9.16). Small punctate hemorrhages may have a rim of long T1, long T2 around them on initial imaging consistent with either edema or ischemia. It may be difficult to decide whether the peripheral part of any hemorrhagic lesion represents evolving hemorrhage, edema or ischemia. Small hemorrhagic lesions do not appear to show a long T2 component. At follow-up, the previous small hemorrhagic lesions are seen as areas of long T1, long T2 regions consistent with gliosis. These are often bigger than the original hemorrhage (Fig. 9.16). This suggests that the hemorrhage may have been secondary within a larger area of primary ischemia with ischemic tissue producing the long T1, long T2 rim around the hemorrhagic lesion.
Figure 9.1 illustrates the evolution of signal intensity within a large parenchymal hemorrhage in the neonatal brain.
< prev | top | contents | next >
Table 9.1 Evolution of signal intensity from hemorrhage (adult data, idealized)
| Age of parenchymal hemorrhage | T1 weighted image | T2 weighted image | Hemoglobin state |
|---|---|---|---|
| Hyperacute (<3h) | Nil | Nil | Oxyhemoglobin |
| Acute (3h–3 days) | Isointense | Low SI | Intracellula rdeoxyhemoglobin |
| Early subacute (3–10 days) | High SI | Low SI | Intracellular methemoglobin |
| Late subacute (10 days–3 weeks) | High SI | High SI | Extracellular methemoglobin |
| Chronic (3 weeks plus) | Nil/low SI | Low SI Hemosiderin | |
| SI, signal intensity. | |||
< prev | top | contents | next >
Table 9.2 Evolution of signal intensity in parenchymal hemorrhage (neonatal data)
| Age of hemorrhage | T1 weighted image | T2 weighted image |
|---|---|---|
| 2 days | Nil/high SI rim | Low SI |
| 3–10 days | High SI/nil | Low SI (with ↑high SI periphery) |
| 10 days–21 days | High SI | High SI |
| 3–6 weeks | High SI | High SI (with ↑low SI periphery) |
| 6 weeks–10 months | Nil/min high SI | Low SI/nil |
| 10–22 months | Nil | Min low SI/nil |
| SI, signal intensity. | ||
< prev | top | contents | next >
Table 9.3 Evolution of signal intensity in extracerebral hemorrhage (neonatal data)
| Age of hemorrhage | T1 weighted image T2 | weighted image |
|---|---|---|
| <3 days | High SI | Low SI/nil |
| 3 days | High SI | High SI |
| 3–10 days | High SI | Low SI (some high SI)* |
| 10–21 days | High SI | Low SI (some high SI)* |
| 3–6 weeks | Min high SI/nil | Low SI |
| 6 weeks–10 months | Nil | Low SI/nil |
| *In larger lesions; SI, signal intensity. | ||
< prev | top | contents | next >
Etiology
The etiology of hemorrhagic lesions differs according to the site of hemorrhage and the gestational age of the infant.
Hemorrhagic lesions are associated with perinatal trauma, asphyxia and infection as well as congenital and acquired clotting disorders, but may occur spontaneously without a cause being found20. Occasionally, hemorrhages arise from a vascular anomaly (see Chapter 12) and rarely from a malignancy. Clinically, hemorrhagic lesions may be asymptomatic or they may be associated with signs of birth trauma, signs of birth asphyxia or bleeding from other sites. Asphyxiated infants often have prolonged and difficult deliveries and may develop disseminated intravascular coagulation. In an individual infant there may be several precipitating factors which result in a hemorrhagic lesion.
Hemorrhage may occur as the principal lesion or may complicate venous or arterial infarction, for example parenchymal venous infarction in the preterm infant (Fig. 9.26). It is therefore appropriate to perform a hemorrhagic and thrombotic screen in any term neonate presenting with intracranial hemorrhage. In addition, details of vitamin K administration need to be confirmed8 and the mother’s blood examined for platelet antibodies to exclude alloimmune thrombocytopenia (Fig. 9.2). These hematological investigations should also be performed in the preterm neonate presenting with anything other than an uncomplicated germinal layer/intraventricular hemorrhage.
Approximately 5% of term infants with signs of hypoxic–ischemic encephalopathy (HIE) have marked parenchymal hemorrhagic lesions. These infants may also have hypoglycemia and jaundice suggestive of an underlying metabolic disorder (Fig. 9.19) although a specific diagnosis may not be found. There is an unclear association between hypoglycemia and hemorrhage. The typical pattern of injury associated with hypoglycemia is an ischemic parasagittal lesion, usually in the posterior parietal lobes (see Chapter 6). It is possible that when hemorrhage is seen in infants with hypoglycemia that these lesions represent hemorrhagic infarcts (Fig. 9.3)
Hemorrhagic lesions that occur prior to delivery also have variable etiology including trauma, congenital clotting disorders, alloimmune thrombocytopenia, infection and drug abuse2, 19. Hemorrhagic lesions may be detected on antenatal ultrasound scan or occasionally with fetal MRI, or they may present as relatively mature lesions shortly after birth. In infants with marked ventricular dilation at birth, signs of short T2 along the ventricular outline may be the only clue to a previous hemorrhage (Fig. 9.4).
In the neonate who has already been discharged from hospital, non-accidental injury needs to be considered as a cause of cerebral hemorrhage (see Chapter 13) in addition to late hemorrhagic disease of the newborn18.
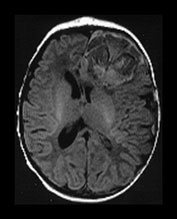

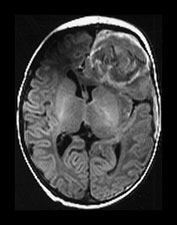

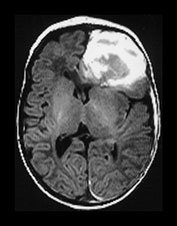


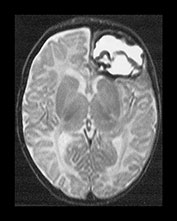


Fig. 9.1 This female infant was delivered at term by normal vaginal delivery. Her Apgar scores were 7 at 1min and 9 at 5min. She was discharged home at 24h. Her mother noted abnormal movements consistent with fits from day 2. T1 weighted (SE 860/20) and T2 weighted (SE 2700/120) spin echo and inversion recovery sequences (IR 3400/30/800) in the transverse plane. (a) At 3 days there is a large area of abnormal signal intensity in the left frontal lobe on T1 weighted images (i). This is isointense with a higher signal intensity rim. The area is mainly low signal intensity with a thin high signal intensity peripheral component on T2 weighted images (ii). (b) At 4 days the high signal rim around the hemorrhage is more obvious on both T1 weighted (i) and T2 weighted (ii) images. (c) At 9 days the hematoma is now mostly high signal on the T1 weighted image (i) with an isointense center. There is now a larger rim of high signal intensity on the T2 weighted images (ii) corresponding to the presence of extracellular methemaglobin. (d) At 7 weeks the hematoma is smaller but remains high signal on T1 weighted images (i). It is mostly high signal on T2 weighted images (ii) with a low signal rim and central features. (e) At 3 months the hematoma is largely resolved to leave a cyst. There is a residual high signal intensity on inversion recovery (IR) images (i). There is also a rim of low signal intensity on T2 weighted images (ii) due to the presence of hemosiderin in the walls of the cyst. Her neurodevelopmental outcome was good. At the age of 3 years 2 months she scored between 3 and 3.5 years on Griffiths developmental assessment. She had a right-hand preference but only mild asymmetry in tone in the popliteal angles.


Fig. 9.2 This male infant was delivered at 30 weeksí gestation by emergency cesarian section for maternal pre-eclampsia and fetal distress. He was hypoglycemic from birth and also noted to be thrombocytopenic. A diagnosis of alloimmune thrombocytopenia was made following examination of maternal blood. Cranial hemorrhage was noted on routine ultrasound examination on day 1. MRI at 6 days of age showed several hemorrhagic areas. (a) High ventricular level. T1 weighted (SE 860/20) sequence. There is a large area of high signal intensity on the right consistent with a germinal layer hemorrhage (short arrow). There are multiple areas of abnormal high signal intensity along the ventricular margin, consistent with hemorrhagic venous infarction (long arrow). The hemorrhagic lesions were seen as low signal intensity on T2 weighted images. (b) Level of the mesencephalon. (i) T1 weighted (SE 860/20) sequence. There is a large abnormal high signal intensity which is probably extending from the right temporal horn of the lateral ventricle into the parenchyma (arrowhead). This is consistent with a germinal layer hemorrhage with hemorrhagic venous infarction. The germinal layer hemorrhage probably originates from residual germinal matrix at the roof of the temporal horn. There is an intraventricular hemorrhage (arrow). (ii) T2 weighted (SE 2700/120) sequence. The venous infarct is seen as low signal intensity. The white matter adjacent to the hemorrhagic lesion has an abnormal high signal intensity (arrow). This could be due to edema or ischemia.

Fig. 9.3 This male infant was born at term by emergency cesarian section for fetal distress. Apgar scores were 6 at 1min and 9 at 5min and the cord pH was 7.3. He presented at 2 days of age with convulsions and was noted to be hypoglycemic. MRI was performed at 5 days. During infancy this infant had 2 further convulsions associated with hypoglycemia. No specific diagnosis has been made. T1 weighted (SE 860/20) sequence. Sagittal plane. There are small areas of abnormal high signal intensity within the white matter consistent with acute hemorrhage (arrows). The hemorrhage was seen as low signal intensity on T2 weighted images.

Fig. 9.4 This 3-day-old male infant presented with a large head following delivery at term. T2 weighted (SE 2700/120) sequence. There is massive dilation of the ventricles with several areas of low signal intensity consistent with previous hemorrhage (short arrows). There are additional areas of high signal intensity consistent with old clot (long arrow).
< prev | top | contents | next >
Sites of hemorrhage
Hemorrhage may occur at any of the levels within the cranium as shown in (Fig. 9.5) .
The meninges consist of the dura mater, the subarachnoid layer and the pia mater. The outer part of the dura mater is attached to the bone forming the periosteum. Hemorrhage between the outer dura layer and the skull is termed extradural. The inner layers fold down into the brain to form the falx cerebri, tentorium cerebelli and the falx cerebelli. The dura encircles the sinuses, namely the superior and inferior sagittal, the straight and the right and left transverse sinus. The space between the inner dura layer and the arachnoid layer is minimal and is the site of subdural hemorrhage. The subarachnoid space, however, contains CSF, arteries and veins. In the region of the sagittal sinus the arachnoid layer forms granulations that pierce the dura. These return CSF to the blood in the superior sagittal sinus. The pia mater is thin, rich in capillaries and closely adherent to the brain.
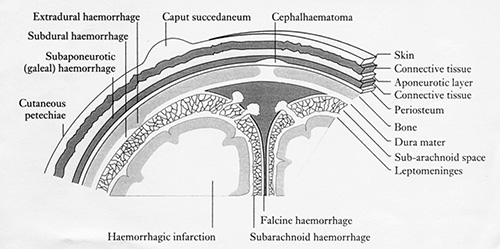
Fig. 9.5 The coverings of the brain. (Reproduced from ‘Vascular lesions of mature infants’ in Neonatal Cerebral Ultrasound by Janet Rennie, Cambridge University Press, 1997, with permission.)
< prev | top | contents | next >
Extracranial hemorrhage
CAPUT SUCCEDANEUM
This very common lesion involves the presence of edema beneath the skin, which may be accompanied by hemorrhage. These collections cross suture lines and usually resolve within a few days. MRI is not necessary in these infants unless a large blood loss is suspected or an underlying lesion is sought. Caput is very common after vaginal delivery (Fig. 9.6) but may be particularly severe following a vacuum extraction.
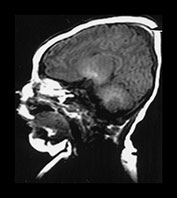

Fig. 9.6 Term infant born by normal vaginal delivery with shoulder dystocia. (a) T1 weighted (SE 860/20) sequence in the sagittal plane aged 1 day showing caput succedaneum with a small area of high signal intensity consistent with hemorrhage (arrow). (b) The caput had disappeared on follow-up scan at 7 days and the head has changed shape.
SUBGALEAL OR SUBAPONEUROTIC HEMORRHAGE
These collections usually increase in size in the first few days after delivery as a consequence of birth trauma, particularly following vacuum extraction (Fig. 9.7)7. Blood may track down into the cervical regions underneath the attachments of the occipito-frontalis muscle and blood loss may consequently be massive. Subgaleal hemorrhage may also occur following non-accidental injury.


Fig. 9.7 Subgaleal hemorrhage. This female infant was born at term by vacuum extraction for fetal distress. The cord pH was 6.7 and Apgar scores were 0 at 1, 5 and 10min. She developed stage III HIE and died at 2 days of age. (a) T1 weighted (SE 860/20) sequence. Transverse plane at 1 day of age. There is an extensive isointense extracerebral collection around the surface of the skull (arrow) (b) T2 weighted (SE 2700/120) sequence. The extracerebral collection has a high signal intensity. There is an additional more circumscribed area, which is low signal intensity (arrowhead).

Fig. 9.8 This male infant was delivered at term by emergency cesarian section for fetal distress. He developed stage II HIE and was imaged at 7 days. T1 weighted (SE 860/20) sequence. There are bilateral areas of high signal intensity consistent with cephalhematoma (arrow). The cephalhematoma was seen as a low signal intensity on T2 weighted images.
CEPHALHEMATOMA
A cephalhematoma is a subperiostial hemorrhage and is therefore confined by cranial sutures (Fig. 9.8). Cephalhematomas occur in approximately 1% of live births and are more common with forceps delivery. They may increase in size following the delivery and may then take several weeks to resolve. They are not of clinical significance but may be associated with other lesions within the brain. Some cephalhematomas may calcify.
< prev | top | contents | next >
Subdural hemorrhage
The incidence of subdural hemorrhage is likely to be underestimated, as small collections may be asymptomatic10. Subdural hemorrhages are associated with prolonged, difficult and or traumatic deliveries either instrumental or by breech presentation. Major lesions are now relatively uncommon with improved obstetric care and the trend for fetuses presenting by the breech to be delivered by cesarian section. In a recent large series of neonatal subdural hemorrhage over 31% of the infants had a spontaneous vaginal delivery9. Subdural hemorrhage may also occur secondary to congenital clotting disorders4. Subdural hemorrhage is the most common lesion following non-accidental injury and it is therefore important to have a thorough knowledge about the clinical history and the evolution of perinatally acquired subdural hemorrhage.
ETIOLOGY OF SUBDURAL HEMORRHAGE
Prolonged and difficult labor gives rise to excessive vertical molding and fronto-occipital elongation causing stretching of the dura mater, the falx and the tentorium, which may then lead to tearing and consequent venous disruption. Subdural hemorrhage may arise from the bridging veins from the cortex to the superior sagittal sinus or from superficial cortical veins without actual tearing of the dura. As the major sinuses are contained within the dural folds, dural tears may cause extensive bleeding. It is possible that some large subdural hemorrhages are also due to arterial bleeding. Large posterior fossa hemorrhages may arise following over-extension of the neck during a breech delivery. The resulting occipital osteodiastasis causes direct trauma to the contents of the posterior fossa including cerebellar hemorrhage. Rarely, posterior fossa hemorrhage may be secondary to a tumor.
SITES OF SUBDURAL HEMORRHAGE
Tentorial
Major lethal tears of the tentorium are usually infratentorial. They may result in rupture of the vein of Galen, and straight or transverse sinuses. Clots may extend into the posterior fossa and, when large, may result in compression of the brain stem and death. With the advent of modern imaging less severe tentorial tears are now being recognized more often. Blood may stay confined to the free edge of the tentorium but extension can result in either supratentorial or infratentorial (often retrocerebellar) subdural hemorrhage. Hemorrhage from a tentorial tear may also extend into the ventricular system, the cerebral parenchyma or the cerebellar parenchyma. Posterior fossa hemorrhage may also result from rupture of small infratentorial veins with an intact tentorium. Small subdural hemorrhages in the posterior fossa are common in infants imaged following birth asphyxia and are usually of no clinical significance. Infratentorial subdural hemorrhage may be difficult to distinguish from transverse sinus thrombosis (Fig. 9.9). The two may co-exist or a subdural hemorrhage may compress the sinus predisposing to thrombosis.

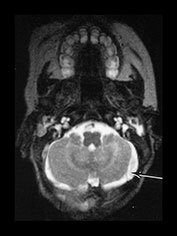
Fig. 9.9 This term infant was delivered by vacuum extraction. Apgar scores were 3 at 1min and 7 at 5min. He developed convulsions on day 1. He was imaged at 14 days. (a) T1 weighted (SE 860/20) sequence. There is high signal in the posterior fossa consistent with subdural hemorrhage (arrow). (b) T2 weighted (2700/120) sequence. The hemorrhage is high signal intensity consistent with a perinatal lesion in this infant. Differentiation from transverse sinus thrombosis may be difficult.
Falx
Ruptures of the falx are much less common than those in the tentorium. They usually result in hemorrhage from the inferior sagittal sinus and give rise to a clot in the longitudinal cerebral fissure overlying the corpus callosum.
Convexity
Rupture of superficial cortical veins gives rise to a convexity subdural hemorrhage, which may be accompanied by subarachnoid hemorrhage. Convexity hemorrhage is less common than posterior fossa hemorrhage but the two may co-exist. When perinatal in origin these convexity hemorrhages are mainly unilateral. Larger convexity hemorrhages may be associated with more marked changes within the brain parenchyma. Infarction of the brain may occur either from arterial occlusion6 or possibly from impaired venous drainage (Fig. 9.10). Large parenchymal hemorrhages may also occur. These may occur as separate lesions because of a hemorrhagic tendency or occur secondarily in associated areas of infarction (Fig. 9.19).
Large subdural hemorrhages may result in impairment of CSF flow and associated ventricular dilation or widening of the extracerebral space (external hydrocephalus). The impairment may be secondary to occlusion of the foramina by a mass effect of the subdural or from interference with the reabsorption of CSF (Fig. 9.19). The evolution of subdural hemorrhage may result in the formation of a subdural effusion, which may remain at the site of a previous subdural for many months. Effusions are also associated with rebleeding although we have not seen this phenomenon following a perinatally acquired subdural hemorrhage.
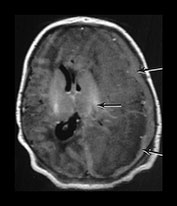
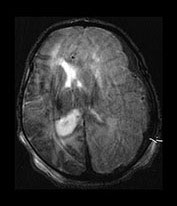

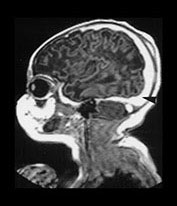
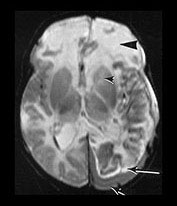
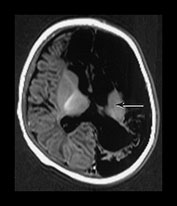

Fig. 9.10 This female infant was born at 39 weeks’ gestation by vacuum extraction. There was prolonged rupture of membranes and shoulder dystocia at delivery. The Apgar scores were 8 at 1min and 10 at 5min, the cord pH was 7.24. She developed a tense fontanelle and generalized convulsions starting at 20 h of age. (a) Aged 2 days (i). Inversion recovery (IR 3800/30/950) sequence. There is a large isointense subdural hemorrhage (lateral arrows) on the left producing a mass effect. There is loss of gray/white matter contrast throughout the left hemisphere and possibly in the frontal lobe on the right. There is some high signal intensity within the posterior limb (central arrow) on the left but it is distorted. (ii) T2 weighted (SE 2700/120) sequence. The subdural is seen as low signal intensity (arrow). (b) Aged 10 days (i) (ii). Inversion recovery (IR 3800/30/950) sequence. The extensive subdural hemorrhage is now seen as high signal intensity in both transverse and sagittal planes (black short arrow/arrowhead). There is widespread abnormal low signal intensity within the white matter (long arrow) with highlighting of the cortex (short arrow) consistent with infarction. The cortical highlighting is likely to be secondary to capillary proliferation. There is no high signal intensity from myelin in the posterior limb on the left (small arrowhead). (iii) T2 weighted (SE 2700/120) sequence the subdural is isointense with lower signal bands within it (short arrow). There is an inner layer of high signal intensity (long arrow). There is complete loss of gray/white matter differentiation in the frontal lobes and some loss posteriorly on the left (large black arrowhead). There is abnormal high signal intensity in the caudate heads, left more than right (small arrowhead). The low signal intensity from myelin is clearly seen in the right but not the left posterior limb of the internal capsule. (c) Inversion recovery (IR 3400/30/800) sequence aged 12 weeks. (i) Low ventricular level. There is a widened extracerebral space with left hemispheric infarction and left basal ganglia infarction. There is some residual thalamic tissue on the left (arrow) but no myelin in the internal capsule. There is additional loss of the right frontal lobe. There is ventricular dilation, which is more marked on the left. (ii) Level of the mesencephalon. There is almost total infarction of the left temporal lobe and asymmetry of the brain stem consistent with Wallerian degeneration (arrow). At 18 months this infant had a marked right-sided hemiplegia and generalized developmental delay, performing between 8 and 14 months on the Griffiths developmental scales. She also had a strabismus. Her head circumference had crossed from the 10th centile to the 50th centile despite this extensive tissue loss.
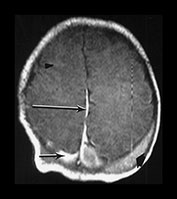
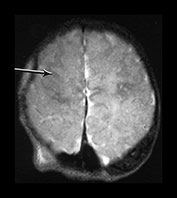
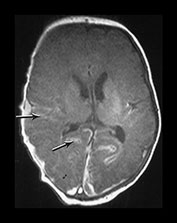
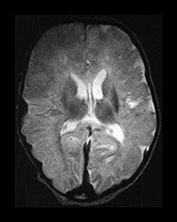
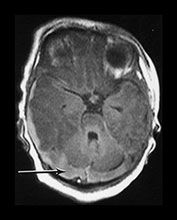
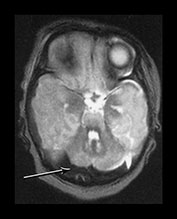


Fig. 9.11 This female infant was born at term by vacuum extraction. Both placental and cord abruption were noted at the delivery. Her Apgar scores were 0 at 1min and 0 at 5min. She developed stage II HIE. She was imaged at 5 days.
(a) Centrum semiovale. (i) T1 weighted spin echo (SE 860/20) sequence. There is high signal intensity along the interhemispheric fissure (long arrow) and around the posterior part of each hemisphere (short arrow) consistent with extensive subdural hemorrhage. There is a localized slightly high signal intensity on the left consistent with a cephalhematoma (large black arrowhead). There is some slightly high signal intensity outlining the cortical markings consistent with cortical highlighting (small arrowhead). (ii) T2 weighted (SE 2700/120) sequence. The cephalhematoma and subdural hemorrhage have a low signal intensity. The ‘cortical highlighting’ is seen more easily than on the T1 weighted image. It has a low signal intensity (arrow).
(b) Low ventricular level. (i) T1 weighted spin echo (SE 860/20) sequence. There is high signal intensity lining the sulci consistent with subarachnoid hemorrhage (arrows). This appears different to the superior levels of cortical highlighting shown in (a). There is marked loss of gray/white matter differentiation throughout the brain. (ii) T2 weighted (SE 2700/120) sequence. The subarachnoid hemorrhage has a low signal intensity.
(c) Posterior fossa. (i) T1 weighted spin echo (SE 860/20) sequence. There is bilateral subdural hemorrhage which is slightly high signal intensity (arrow). (ii) T2 weighted (SE 2700/120) sequence. The subdural is low signal intensity (arrow).
(d) T1 weighted spin echo (SE 860/20) sequence. Parasagittal plane. (i) Lateral view. There is extensive high signal around the Sylvian fissure (arrow). (ii) Sagittal plane. There is high signal along the superior aspect of the corpus callosum (arrow). This child is currently 1 year old. She has severe microcephaly and generalized developmental delay.
< prev | top | contents | next >
Subarachnoid hemorrhage
The exact incidence of subarachnoid hemorrhage is uncertain although it is a relatively common and usually benign form of hemorrhage. Diagnosis based on the presence of red blood cells in a CSF tap probably overestimates the incidence. It is more common in preterm infants. On MRI subarachnoid hemorrhage may give rise to diffuse high signal around the central fissure. This has to be distinguished from changes due to normal myelination in the corticospinal tracts around the central sulcus and to the abnormal short T1 referred to as ‘cortical highlighting’ as seen in infants with HIE (see Chapter 6). Abnormal signal intensity from subarachnoid hemorrhage follows the contours of the brain and should outline sulci (Fig. 9.11 and Fig. 9.20). More extensive subarachnoid hemorrhage may be difficult to distinguish from subdural hemorrhage and the two may co-exist.
< prev | top | contents | next >
Thrombosis of sagittal sinus
ANATOMY
The venous drainage of the brain involves two major systems (Fig. 9.12). The external system of the superior sagittal sinus and the internal system of the inferior sagittal sinus join with the deep cerebral veins to form the great vein of Galen (great cerebral vein) and the straight sinus. The two sagittal sinuses join to drain into the straight sinus. The straight sinus drains into the right and left transverse sinus.
ETIOLOGY
Thrombosis of the sinuses may be secondary to trauma, an increased hematocrit, sepsis (see Chapter 10), dehydration or to cardiac failure11. Thrombosis at multiple sites has also been reported in infants with inherited thrombotic disorders such as factor V Leiden17. Several factors may combine in one individual (Fig. 9.13). Flow within the sinuses is relatively slow in the neonate, perhaps predisposing them to thrombosis.
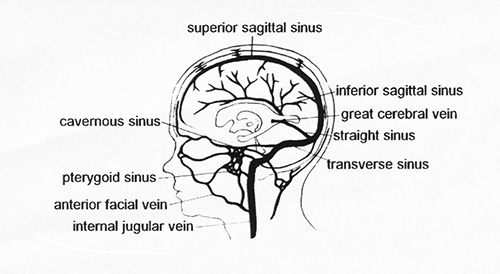
Fig. 9.12 The sinuses of the brain. (Adapted with permission from Volpe, Neurology of the Newborn 3rd edn. Saunders.)


Fig. 9.13 This male infant with Down’s syndrome was born at 39 weeks’ gestation by cesarian section for fetal distress. Apgar scores were 8 at 1min and 9 at 5min. He presented with generalized convulsions on day 2. He was found to be both thrombocytopenic and polycythemic. (a) T1 weighted spin echo (SE 860/20) sequence aged 8 days. (i) There are bilateral hemorrhagic lesions of the cortex superiorly (arrow) with (ii) smaller white matter hemorrhagic lesions (long arrow) seen on lower slices and (iii) persistent high signal within the superior sagittal sinus consistent with sagittal sinus thrombosis (short arrow). (b) T2 weighted spin echo (SE 2700/120) sequence aged 8 days. (i) The superior cortical hemorrhagic lesions are seen as a mixture of high, isointense and low signal intensity and (ii), (iii) the superior sagittal sinus is seen as low signal intensity (arrow) consistent with either thrombosis or very fast flow. The parenchymal white matter lesions are difficult to identify. At 2.5 years he showed a global developmental delay consistent with Down’s syndrome, scoring between 14.5 and 17 months on Griffiths developmental assessment. He had a right-hand preference but no focal neurological signs.
IMAGING APPEARANCES
The differential diagnosis of sinus thrombosis includes changes due to normal or slow flow and subdural hemorrhage. Abnormally slow flow within the sinuses, secondary to congestive cardiac failure, may cause a ‘functional’ thrombosis (Fig. 9.15). Thin image slices are needed to eliminate changes secondary to blood flow and it is helpful to obtain images in several planes, a sagittal image being most useful to confirm the diagnosis of sagittal or straight sinus thrombosis. On T1 weighted transverse images normal flow in the sagittal sinus will be high or low signal intensity depending on the direction and velocity of flow in relation to the slice. Thrombosis is a possibility if the signal intensity within the sinus is high on all slices (Fig. 9.13). On T2 weighted imaging, low signal intensity within the sagittal sinus may represent fast flow or thrombosis. Injection of contrast may help confirm the diagnosis as may repeat imaging. Enhancement suggests flow within the sinus and therefore excludes complete thrombosis. Phase-encoded angiography is specific for flow and may be of considerable value in demonstrating obstruction. The diagnosis may be very difficult. If there is additional subdural hemorrhage this may compress the sinus and make image interpretation more difficult. This compression can in itself result in partial or complete thrombosis.

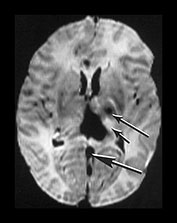
Fig. 9.14 This male infant was born by normal vaginal delivery at term. Apgar scores were 2 at 1min and 5 at 5min and the cord pH was 6.7. The EEG was isoelectric. Cranial ultrasound showed bilateral IVH with ventricular dilation, subdural hemorrhage and a possible vein of Galen aneurysm. The infant was weaned off the ventilator but required nasogastric feeding until his death at 2 months of age. (a) T1 weighted spin echo (SE 860/20) sequence sagittal plane aged 5 days. There is a large hemorrhagic lesion in the posterior thalamus (arrowhead) extending into the retrothalamic cistern. The vein of Galen and straight sinus are seen as low signal intensity, suggestive of thrombosis. They are distended and abnormally tortuous (short arrow). This may represent a primary vascular malformation. There is abnormal low signal intensity within the superior sagittal sinus (long arrow). This is also suggestive of thrombosis. (b) T2 weighted spin echo (SE 2700/120) sequence. There is low signal intensity in the lateral and third ventricle consistent with hemorrhage and in the straight sinus consistent with thrombosis (large arrow). There is abnormal high signal intensity within the thalami, more marked on the left (short small arrow). There is also abnormal low signal intensity in the left thalamus, more anteriorly (long small arrow). There is abnormal high signal intensity within the left posterior limb of the internal capsule. Postmortem at 2 months of age showed old thrombus within the torcula, occluding the junction with the left transverse and superior sagittal sinus. There was no evidence of an aneurysm of the vein of Galen and no comment on the straight sinus.


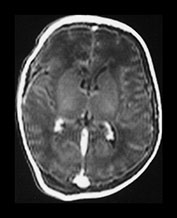
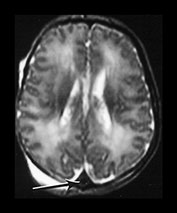
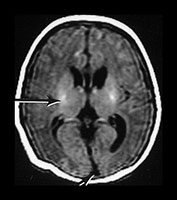
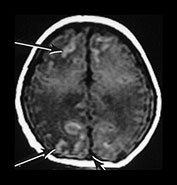
Fig. 9.15
This term infant was born by emergency cesarian section for fetal distress. The cord pH was 6.8 and Apgar scores were 0 at 1min. He was noted to be hypoglycemic on day 1 but this was easily corrected. Abnormal clotting with thrombocytopenia was also noted on day 1 and he required five platelet transfusions. He developed congestive cardiac failure and was grossly edematous at the time of imaging. Liver function was also persistently abnormal.
(a) T1 weighted (SE 860/20) sequence. (i), (ii) There is isointense signal within the sagittal and transverse sinus and high signal in the straight sinus consistent with thrombosis (long arrows). There is some loss of gray/white matter differentiation. There is normal high signal intensity from myelin in the posterior limb of the internal capsule (short arrow). (iii), (iv) T1 weighted (SE 860/20) sequence with contrast enhancement. The sagittal, straight and transverse sinuses enhance with contrast suggesting that the thrombosis is only partial or that the appearances are consistent with very slow flow secondary to the congestive cardiac failure.
(b) T2 weighted (SE 2700/120) sequence in the transverse plane at 19h. There is low signal intensity in the sagittal sinus (arrow); this was seen on every slice and is consistent with either thrombus or high flow. (c) T1 weighted (SE 860/20) sequence (i), (ii) at 5 days of age. There is now some low signal within the sagittal sinus (short arrows) but there are multiple areas of abnormal signal intensity in the cortex and subcortical white matter consistent with hemorrhagic infarction (long arrows). (ii) The basal ganglia, thalami and internal capsules (arrow) (i) are of normal appearance. The evolution of these images is consistent with a diagnosis of partial thrombosis secondary to congestive cardiac failure, which has resulted in multiple areas of cortical and subcortical infarction. The normal appearance of the internal capsules is an encouraging sign for future motor development but neurocognitive function is unlikely to be normal.
COMPLICATIONS
Thrombosis of the sinuses impedes venous drainage from the brain and may result in venous infarction within the region of brain that drains into the sinus. This involves the thalami in thrombosis of the straight sinus and vein of Galen (Fig. 9.14) or the cortex and subcortical white matter with thrombosis of the sagittal sinus (Fig. 9.15). Infarction is characteristically bilateral and hemorrhagic. It typically involves the cortex and subcortical white matter.
< prev | top | contents | next >
Parenchymal hemorrhage
Parenchymal hemorrhages may be focal or multifocal and of any size. They may be clinically symptomatic or found incidentally. Predisposing factors include birth asphyxia, instrumental delivery and infection. More unusual causes are primary clotting abnormalities or congenital vascular abnormalities (Fig. 9.20) (see Chapter 12).
Multifocal small hemorrhages may be found in term infants presenting with convulsions during the first few days of life. These infants may have had some fetal distress but do not fulfill all the criteria for HIE12 (see Chapter 6). They are usually sent to the postnatal ward following delivery and subsequently noted to be twitching (Fig. 9.16). Seizures are usually short lived.
Hemorrhagic lesions in the parenchyma can occur at any gestation (Fig. 9.17) prior to, during or following delivery. Parenchymal hemorrhagic lesions may co-exist with hemorrhage elsewhere in the cranium (Fig. 9.18).
Some infants presenting with HIE develop large intracranial hemorrhages. These infants may have had little documented fetal distress or show fetal distress in the absence of labor. In addition to their neurological complications they show metabolic derangement including abnormal clotting, hypoglycemia and conjugated hyperbilirubinemia (Fig. 9.19). The pattern of injury, mainly white matter, and the neurodevelopmental outcome are atypical for HIE. Basal ganglia involvement may be minimal or asymmetrical and later cognitive problems are more marked than motor impairment. Underlying metabolic disorders should always be sought, although they may not be identified.


Fig. 9.16 This male infant was born at term by normal vaginal delivery. Apgar scores were 9 at 1min and 10 at 5min. He presented with right-sided followed by generalized seizures on day 3. A full clotting and thrombophilia screen were normal (a) Inversion recovery (IR 3800/30/950) sequence (i) T2 weighted spin echo (SE 2700/120) sequence (ii) aged 8 days. There are multiple small hemorrhagic lesions in both hemispheres (arrows). There is mild dilation of the left lateral ventricle. (b) At 6 weeks of age the hemorrhagic lesions were no longer visible on T1 weighted scans (i) but were still evident, although reduced, as low signal intensity, on the T2 weighted images (arrow) (ii). (c) Fluid attenuated inversion recovery (FLAIR) (IR6500/160/2100) sequence at 15 months. There are areas of increased T2 consistent with gliosis (arrow). His last assessment at 5.5 years revealed mild ankle asymmetry only. His general development was very good for his age but he showed some perceptual difficulties.


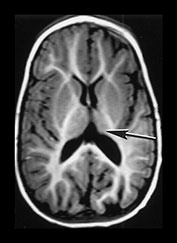

Fig. 9.17 This preterm infant was born at 29 weeksí gestation. Cranial ultrasound demonstrated bilateral intraventricular hemorrhage with a left-sided parenchymal echo density, thought initially to be a venous infarct. (a) Inversion recovery (IR 3800/30/ 950) sequence at 3 weeks. There is high signal in the left frontoparietal lobe consistent with hemorrhage of between 3 days and 6 weeks. This was completely separate from the ventricles. (b) Inversion recovery (IR 3400/30/800) sequence at 9 months showing (i) atrophy of the left frontal lobe (ii) atrophy of the thalamus (arrow) and (iii) asymmetry of the brain stem (arrow). This child is now 7 years old and has a right-sided hemiplegia.


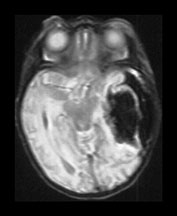


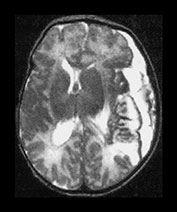
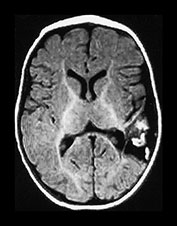

Fig. 9.18 This female infant was born at term by vaginal delivery following manual rotation of the head immediately prior to delivery. The Apgar scores were normal and no resuscitation was required. She went home at 6h of age but was noted to be excessively sleepy. She subsequently developed convulsions and apneas that required ventilation for 3 days. A hemorrhagic screen was normal. (a) Inversion recovery (IR 3800/30/950) sequence (i), (ii) and T2 weighted spin echo (SE 2700/120) sequence (iii), (iv) at 3 days of age. Transverse plane at low ventricular and mesencephalon level. There is a large hemorrhage within the left temporal and parietal lobes with mid-line shift, brainstem deviation and tentorial herniation (not shown). The hemorrhage is mainly isointense on T1 and low signal intensity on T2 weighted images. There is additional subdural hemorrhage in the left Sylvian fissure, although it is quite difficult to separate the two lesions. There is mild dilation of the right lateral ventricle which appears to contain hemorrhage. This dilation is presumably secondary to obstruction. (b) Inversion recovery (IR 3800/30/950) sequence and T2 weighted spin echo (SE 2700/120) sequence. Two weeks of age. The hemorrhagic lesion in the temporal and parietal lobes is now all high signal on the T1 weighted image (i) and on the T2 weighted image (ii). It is possible to differentiate the subdural from the parenchymal hemorrhage on T2 weighted image but not on the T1 weighted image. It is possible to see myelin in both posterior limbs although there is an area of abnormal signal intensity at the base of the internal capsule (arrow), seen most clearly as low signal intensity in (i). There is residual brain swelling, mid-line shift and brain stem deviation and there is mild right-sided ventricular dilatation.
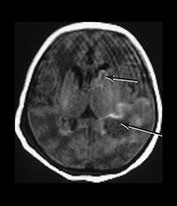


Fig. 9.19 This male infant was born by emergency cesarian section at term for severe fetal distress. The cord pH was 6.7. His Apgar scores were 0 at 1 min and 1 at 5min and birthweight was 3920g. He developed convulsions and was staged as HIE II. He had persistent hypoglycemia. He developed a severe neonatal hepatitis with prolonged conjugated jaundice. Ultrasound showed bilateral intraventricular hemorrhage with a lesion in the left temporoparietal lobe. (a) T1 weighted spin echo (SE 860/20) sequence at 3 days of age. There is a hemorrhagic lesion in the left temporal region (long arrow) and in the left caudate head (short arrow). These are isointense with a high signal intensity rim. This image is motion artifacted. (b) Inversion recovery (IR 3400/30/800/) sequence at 2 years of age. (i) Low ventricular level. There is a porencephalic dilation of the left posterior ventricular horn at the site of the perinatal hemorrhage. There is a paucity of myelin. (ii) Mid-ventricular level. There is bilateral ventricular dilation with angulation of both ventricles posteriorly. These images could easily be mistaken as being secondary to periventricular leukomalacia. (iii) T2 weighted spin echo (SE 2700/120) sequence. There is high signal consistent with gliosis in the periventricular white matter, most marked posteriorly (arrows). (iv) Fluid attenuated inversion recovery (FLAIR) (IR 6500/160/2100) sequence. This sequence accentuates the gliotic changes. The late imaging findings in this child are typical of periventricular leukomalacia but are not due to antenatal injury to the preterm brain. They are the result of a well-documented perinatal process. At 4 years of age he had signs of a mild diplegia but was mobile. There was some upper limb involvement with clumsy movements of his arms and hands. He was hyperactive with severe cognitive deficits.
< prev | top | contents | next >
Arterio-venous malformations
These are dealt with in a separate chapter (see Chapter 12). Figure 9.20 shows an example of multiple hemangiomas in the brain of a neonate. They were associated with acute perinatal hemorrhage and were initially indistinguishable from primary hemorrhage without an obvious vascular malformation.

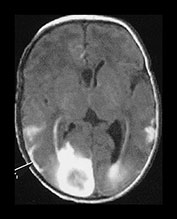

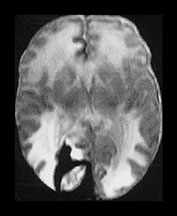


Fig. 9.20 This male infant was born by emergency cesarian section for fetal distress at 36 weeksí gestation. Cardiotocogram (CTG) showed decelerations prior to delivery and there were decreased fetal movements for 24h. Apgar scores were 4 at 1min and 7 at 5min. The cord pH was 7.04 and the birthweight was 1.96kg. He developed respiratory distress and was ventilated for 1 day. Routine ultrasound demonstrated a well-localized echo density in the right frontoparietal region. He developed convulsions and was given phenobarbital. (a) T1 weighted spin echo (SE 860/20) (i), (ii) and T2 weighted spin echo (SE2700/120) (iii), (iv) aged 7 days. There are multiple hemorrhagic lesions, many appear to lie on the meningeal surface and project inwards. There is a large subarachnoid hemorrhage (arrowhead) which is exerting a mass effect. At 3 months of age this infant developed skin hemangiomas and further imaging demonstrated a hemorrhagic lesion on the lung. A diagnosis of multiple hemangiomatosis was made. The skin lesions have regressed. (b) Inversion recovery (IR 3400/30/800) (i) (ii) and T2 weighted spin echo (SE 2700/120) (iii) sequence at 2 years. There are defects in the brain at the sites of the previous hemorrhagic lesions. There is low signal intensity lining (arrow) one of these defects and consistent with hemosiderin, on the T2 weighted image (iii). At 5 years of age he showed some dystonic components to fine hand and finger movement and had some mild asymmetry of tone around the ankle. He had some visual difficulties and was hyperactive. He read well for his age.
< prev | top | contents | next >
Thalamic hemorrhage
Thalamic hemorrhage is usually unilateral and associated with intraventricular hemorrhage1. Primary thalamic hemorrhage needs to be distinguished from the bilateral thalamic abnormalities seen in HIE. Infants with thalamic hemorrhage do not usually present with ‘full blown’ HIE (Fig. 9.21). Although the bilateral lesions seen following HIE are high signal intensity on T1 weighted images and low signal intensity on T2 weighted images, pathological comparisons in this condition do not identify hemorrhage in the thalami. The signal intensities seen may, however, be due to capillary proliferation in regions of infarction. In addition, following asphyxia, the abnormal signal intensity within the thalami is bilateral and usually more focal, effecting the lateral thalamic nuclei and sometimes the medial nuclei.


Fig. 9.21 This male infant was born by normal vaginal delivery at term. Apgar scores were 8 at 1min and 9 at 5min. His birthweight was 3.01kg. He developed seizures at 12h of age. Cranial ultrasound showed a large IVH with right parenchymal and thalamic involvement. His EEG was abnormal with discontinuous background. (a) Inversion recovery sequence (IR 3800/30/950) aged 8 days. There is hemorrhage involving the right thalamus and the right lateral ventricle. There is bilateral ventricular dilation. (b) Inversion recovery sequence (IR 3800/30/950) imaged 18 days. There has been resolution of the hemorrhage. There is atrophy of the left thalamus (arrow). The ventricles remain dilated and are now irregular in outline. Myelin is visible in both posterior limbs of the internal capsule. (c) Inversion recovery (IR 3600/80/300) sequence aged 9 months. There is thalamic atrophy on the right. The ventricles remain dilated and irregular in outline. Myelination is reduced generally. These appearances could be mistaken for being secondary to periventricular leukomalacia. At 19 months he was hypotonic and had a homonomous hemianopia but no other focal neurological signs. He was not pulling himself to stand and moved by bottom shuffling. He had general developmental delay more marked with performance items. He had an abnormal EEG and was on carbemezapine.
< prev | top | contents | next >
Basal ganglia hemorrhage
Hemorrhage into the caudate is usually seen as a secondary extension from germinal layer hemorrhage in the preterm infant. It may also occur as an isolated event in the term infant (Fig. 9.22), although differentiation from a hemorrhagic infarction involving a deep branch of the middle cerebral artery is not easy (see Chapter 7).
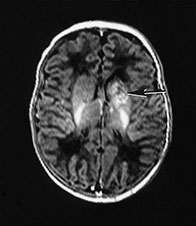

Fig. 9.22 This female infant was born at 41 weeks’ gestation by emergency cesarian section. Apgar scores were 8 at 1min, and 9 at 5min. She developed seizures. EEG showed asymmetrical seizure activity and cranial ultrasound showed an echo density in the left basal ganglia. (a) Inversion recovery (IR 3800/30/950) sequence aged 10 days. There is an isolated hemorrhagic lesion in the left caudate head, this may be a hemorrhagic infarction. (b) Follow-up imaging at 3 months showed a cystic infarct of the left caudate head (arrow). At 18 months this child showed no asymmetry on neurological examination. Her developmental scales were between 16.5 and 20 months, the lowest score being for performance with some difficulty with the puzzle tasks. The child has developed normally and had no signs of a hemiplegia at 3 years.
< prev | top | contents | next >
Cerebellar hemorrhage
Cerebellar hemorrhage has been reported in 10–25% of very preterm infants on postmortem studies14. It may be related to the standard of care and positioning of the infant and has been associated with increased pressure from mask ventilation15. Using MRIwe have identified hemorrhagic lesions within the cerebellum in approximately 3% of a cohort of infants born at less than 30 weeks’ gestation. Cerebellar hemorrhage may escape detection using ultrasound through the anterior fontanelle and result in cerebellar atrophy later on13. This atrophy could similarly be secondary to undiagnosed infarction (Fig. 9.29). Routine ultrasonography through the posterior fontanelle in premature infants may improve detection. Improved detection may confirm that cerebellar hemorrhage in preterm infants is often clinically silent and may not always be associated with significant morbidity.
In the term infant cerebellar hemorrhage may be primary, secondary to venous infarction or may complicate massive intraventricular or subarachnoid hemorrhage. Laceration of the cerebellum may occur secondary to trauma such as occipital osteodiastasis in breech deliveries. The vermis is reported to be the initial site of the lesion in the majority of term infants.
Symptoms often occur in the first day in the term infant following a difficult delivery but presentation may not occur until later in the neonatal period (Fig. 9.23). There may be brain stem disturbances, with abnormalities in eye movements. Increasing head circumference may be secondary to ventricular dilation (Fig. 9.23). The outcome with severe cerebellar hemorrhage is poor with a high mortality in preterm infants. It is associated with a lower mortality in term infants but there is a high incidence of motor and intellectual problems with prominent cerebellar signs21.
The decision as to whether surgical treatment is necessary is difficult and it is likely that surgery is best reserved for those children with brain stem signs16.


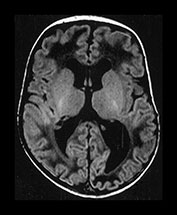
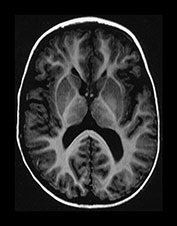

Fig. 9.23 This male infant was born by spontaneous vaginal delivery at term. The cord pH was 7.16 but the Apgar scores were normal. He presented at 1 week of age with an increasing head circumference. Cranial ultrasound showed dilated lateral and third ventricles with increased echo density within the cerebellum. (a) T1 weighted spin echo (SE 860/20) sequence aged 7 days. (i) There is a mixed signal intensity hemorrhagic lesion involving the right hemisphere and vermis of the cerebellum (arrow). (ii) High signal intensity is seen in the vermis (arrow). There is marked dilation of the lateral ventricles and the third ventricle. The aqueduct is also slightly dilated. There is abnormal low signal intensity within the white matter, presumably due to edema from the raised intraventricular pressure. (b) T1 weighted spin echo (SE 860/20) sequence. Sagittal (i) and transverse (ii) plane aged 23 days. The hemorrhage is resolving (arrow) (i). The ventricles remain dilated and the white matter still shows abnormal low signal intensity (ii). (c) Inversion recovery (IR 3400/30/800) (i) and T1 weighted (SE 860/20) (ii) sequence in the coronal plane aged 15 months. Myelination has proceeded normally. The ventricles are now only mildly dilated (i). There is infarction of the posterior part of the right cerebellar hemisphere (arrow) (ii). Developmental follow-up at 15 months of age is within normal limits with minimal delay in speech. On neurological examination he is hypotonic. His head growth remains along the 50th centile. A hemorrhagic screen was normal.
< prev | top | contents | next >
Intraventricular hemorrhage
INCIDENCE AND ETIOLOGY
Intraventricular hemorrhage (IVH) in the preterm brain usually arises from the germinal matrix (GM) whilst intraventricular hemorrhage in the term infant originates from the choroid plexus. Germinal matrix/intraventricular hemorrhage (GMH/IVH) occurs in between 30 and 40% of infants weighing less than 1500g or approximately 30weeks’ gestation. The incidence increases with decreasing gestation. There has been a decreased incidence in severe IVH and its complications with the increasing use of surfactant therapy.
APPEARANCES
MRI provides excellent visualization of the GM and is able to identifying regions of matrix in the roof of the temporal horn, which are not visualized with ultrasound (Fig. 9.24). MRI can be used to document the involution of the GM with increasing gestation (Fig. 9.24). Imaging through the transverse plane may explain its superiority in detection over ultrasound where images are routinely obtained only in the coronal and sagittal planes. In a cohort of infants of less than 30 weeks’ gestation we have found an incidence of GMH/IVH of approximately 40% on initial MRI (see Chapter 3).
GMH may occur at different sites and can be differentiated from normal GM by its size and shape (Fig. 9.24). IVH secondary to GMH is most often identified in the posterior horns of the lateral ventricle (Fig. 9.24). When extensive, however, it can be seen tracking through the ventricular system (Fig. 9.26aii) . Low signal intensity on T2 weighted images due to the presence of hemosiderin may be seen weeks or even months after a GMH/IVH. In addition, on T1 weighted images, a high signal lining the ventricle may be seen months after a hemorrhage. This may represent enhancement of ependymal lining but the etiology is unclear.
IVH can be graded with CT and with cranial ultrasound but this has not been formally done with MRI. A grading system using MRI may need to add more grades in order to describe the different sites involved.
In term infants the germinal layer has largely involuted and intraventricular hemorrhage in the term infant usually originates from the choroid plexus (Fig. 9.25). The site of origin may be difficult to identify in the presence of a large IVH.

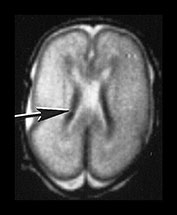
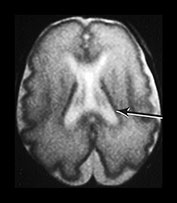
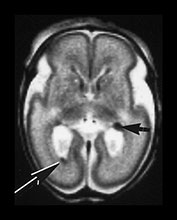

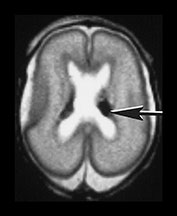

Fig. 9.24 Germinal matrix normal appearances.
(a) Twenty-four week gestation infant aged 4 days. T1 weighted (SE 860/20) sequence (i) and T2 weighted fast spin echo (FSE 3000/208) sequence (ii) at mid-ventricular level showing normal appearances of the germinal layer overlying the caudate as symmetrical regions of low signal intensity on T2 and high signal intensity on the T1 weighted image (arrows).
(b) Twenty-eight week gestation infant T2 weighted fast spin echo (FSE 2700/120) sequence. Mid-ventricular level. (i) The germinal matrix is involuting and is seen as a narrower area of low signal intensity (arrow). (ii) Low ventricular level. The germinal layer can be seen in the anterior horn of the lateral ventricle and in the roof of the temporal horn. There is a small matrix hemorrhage in the roof of the temporal horn on the left (black arrowhead) and blood in the posterior horn on the right (arrow).
(c) Twenty-four week gestation infant imaged at 1 day of age. T1 weighted (SE 860/20) (i) and T2 weighted fast spin echo (FSE 3000/208) sequence (ii) at mid-ventricular level. There is asymmetry of the germinal matrix consistent with hemorrhage (arrows). T1 weighted (SE 860/20) sequence (iii). There is bilateral intraventricular hemorrhage (arrow). The infant was imaged in the supine position and there is a fluid–fluid level consistent with hemorrhage.


Fig. 9.25 This male infant was born at term following maternal pre-eclampsia and as a result of an IVF pregnancy. Postnatally, he was noted to have a persistent acidosis and high lactate. An initial hemorrhagic screen was negative. Imaged at 7 days of age. (a) T1 weighted spin echo (SE 860/ 20) sequence and (b) T2 weighted spin echo (SE 2700/120) sequence at 7 days of age. There is abnormal signal intensity within the choroid consistent with hemorrhage (arrows).
< prev | top | contents | next >
Complications of GLH IVH
VENOUS INFARCTION
Venous infarction arises as a consequence of thrombosis in the terminal veins of the hemorrhagic germinal layer. Infarcts are usually associated with a large GMH/IVH but may occur with isolated GMH. MRI has improved the detection of lesions that appear to be secondary to venous infarction. Areas of hemorrhagic infarction may occur at any of the sites of germinal matrix that can be identified by MRI5 (Figs 9.26, 9.27 and 9.28). Occasionally, T2 weighted MR images may show multiple linear abnormalities in the white matter of the centrum semiovale associated with hemorrhage in the germinal matrix. These linear abnormalities may represent distended or blocked draining veins.
In surviving infants venous infarction usually evolves to produce a porencephalic cyst (Fig. 9.29). These infants have a high incidence of later hemiplegia. In a study by De Vries looking at preterm infants with unilateral lesions there was a strong association between abnormal signal intensity within the posterior limb of the internal capsule on the affected side and the later development of a hemiplegia3.
As described previously, GMH/IVH may occur antenatally as can the various complications.
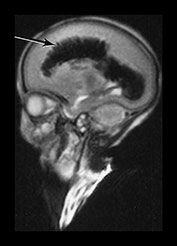

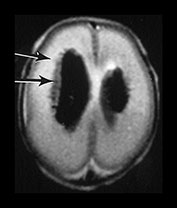

Fig. 9.26 This preterm infant was delivered at 26 weeks. He died at 3 weeks of age and an MRI was performed postmortem. (a) T2 weighted fast spin echo (FSE 3000/208) sequence in (i) sagittal, (ii) coronal and (iii) transverse planes. There is bilateral GMH/IVH. There is abnormal linear signal intensity fanning out from the ventricles consistent with hemorrhagic venous infarction (arrows). There is high SI in the adjacent WM consistent with ischemia (top arrow). (iii) Blood in the third ventricle can be identified on the coronal images (black arrowhead). (b) T1 weighted spin echo (SE 860/20) sequence in transverse plane. The hemorrhage and hemorrhagic infarction are seen as predominantly high signal intensity.

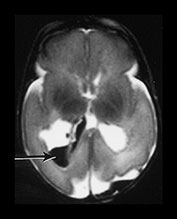
Fig. 9.27 This male infant was the first born of triplets at 24 weeks +5 daysí gestation. He had normal imaging throughout life but had a clinical deterioration at 6 weeks of age associated with an incarcerated inguinal hernia. Imaging was performed immediately after death. T1 weighted spin echo (SE 20/860) (a) and T2 weighted fast spin echo (FSE 3000/208) (b) sequence. There is a hemorrhagic lesion in the right temporal lobe. There is additional hemorrhage within the right posterior horn (arrows) These findings are consistent with venous infarction. Histology confirmed the presence of germinal matrix and intraventricular hemorrhage. The periventricular white matter showed pyknotic cells and axon retraction balls consistent with recent infarction.


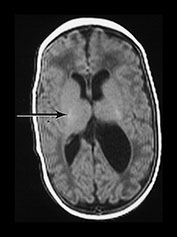
Fig. 9.28 This male infant was born at 26 weeksí gestation, weighing 950g. He was imaged at 2 weeks of age. (a) T1 weighted spin echo (SE 860/20) (i) and T2 weighted fast spin echo (SE 3000/208) (ii) sequences. There is bilateral GMH/IVH with a hemorrhagic lesion adjacent to ventricle on left posteriorly (arrow). This is consistent with a hemorrhagic venous infarction. (b) T2 weighted (SE 120/2700) spin echo sequences (i) and T1 weighted spin echo (SE 20/860) (ii). Repeat imaging at term showed a porencephalic dilation of the left lateral ventricle (i), (ii). The signal intensity within the posterior limb of the internal capsule was symmetrical (arrow). He had no clinical asymmetry at this time.
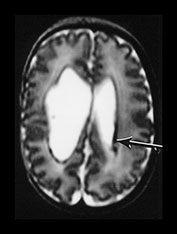

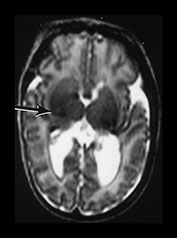

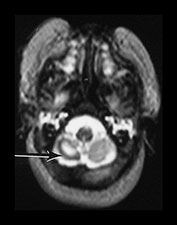
Fig. 9.29 This 25-week gestation infant had bilateral intraventricular hemorrhage with parenchymal involvement on early cranial ultrasound. He was imaged at term (a) T2 fast spin echo weighted (FSE 3000/208) sequence. There is bilateral ventricular dilation with a porencephalic cyst on the right. There is residual hemorrhage seen as low signal intensity along the ventricular lining (arrow). (b) T1 weighted (SE 860/20) spin echo sequence (i) and T2 weighted fast spin echo (FSE 3000/208) sequence (ii). The signal intensity from myelin in the internal capsule of the posterior limb is asymmetrical (arrows). (c) T2 weighted fast spin echo (FSE 3000/208) sequence (i) mesencephalon. There is asymmetry of the brainstem (arrow) but this is opposite to the expected side and (ii) cerebellum. There is cerebellar atrophy with a low signal rim around the atrophied right hemisphere (arrow) consistent with a hemorrhagic infarct. This had not been detected on routine cranial ultrasound. It may be associated with the contralateral brainstem atrophy.
< prev | top | contents | next >
Ventricular dilation
Posthemorrhagic ventricular dilation is due to interference with the normal flow of CSF (Fig. 9.30). The incidence of ventricular dilation increases with the severity of GMH/IVH. Cranial ultrasound is an ideal tool for monitoring ventricular dilation in the presence of an open fontanelle. Many units will have guidelines for measurements of the frontal horns, although dilation tends to be maximal in the occipital or posterior horns (colpocephaly) which are not routinely measured. More detailed imaging with MRI is usually required prior to shunt surgery and for monitoring the progress or shunt complications after closure of the fontanelle. Most modern shunts are MR compatible and good quality images can be produced. It is very important to check the MR compatibility of any intraventricular device (see Chapter 1). Metallic components may move when placed in the magnetic field. They may also cause an enormous susceptibility artifact, which may render images uninterpretable.

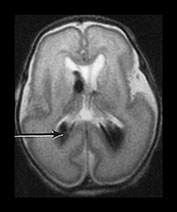


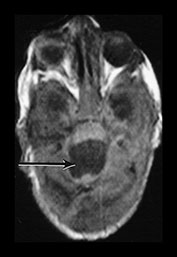
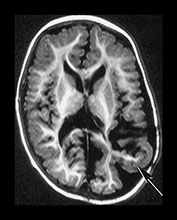


Fig. 9.30 This male infant was the second of twins born at 27 +6 weeks’ gestation. (a) T2 weighted fast spin echo (FSE 3000/208) sequence performed on day 2 done for research purposes shows normal appearances for gestation. (b) T2 weighted fast spin echo (FSE 120/2700) sequence at 7 days of age. There is now bilateral GMH/IVH (arrow). (c) T1 weighted spin echo (SE 20/860) sequence (i) T2 weighted fast spin echo (FSE 120/2700) sequence (ii) at 3 weeks. There is marked bilateral ventricular dilation with residual hemorrhage (arrow). The white matter is homogeneous and is uniformly low signal intensity on T1 and high signal intensity on the T2 weighted images. (d) T1 weighted spin echo (SE 20/860) sequence (i) T2 weighted fast spin echo (FSE 3000/208) sequence (ii) imaged at 6 weeks. There has been insertion of a reservoir on the left. The ventricular dilation is marked but static. The head shape has changed but the diffuse white matter abnormalities remain. (iii) There is marked dilation of the fourth ventricle (arrow). (e) Inversion recovery sequence at 12 months of age. He has had a third ventriculostomy and two revisions of a ventriculo-peritoneal shunt. (i) His lateral venticles are only mildly dilated. He has marked atrophy of the left parietal, temporal and occipital lobes (arrow). (ii) His ‘isolated’ fourth ventricle remains grossly enlarged but clinically asymptomatic. (iii) Sagittal plane. His hugely dilated fourth ventricle can be seen compressing the brainstem. The corpus callosum is very thin (arrow) with an interruption in the mid-body which occurred postsurgery. At 2 years of age he has a mild global developmental delay.
< prev | top | contents | next >
Summary
- Hemorrhage is often present at more than one site.
- MRI can be used to time the onset of lesions.
- Evolution of the signal intensity of hemorrhage depends on the site and size of the lesion.
- Hemorrhage may be primary or secondary and occur within an arterial or venous infarct.
- There is a strong association between traumatic delivery, especially vacuum extraction and hemorrhagic lesions.
- A coagulation and thrombotic profile should be performed in all infants with significant hemorrhage.
- Neurodevelopmental outcome varies with the site of hemorrhage, the presence of additional lesions and the underlying cause.
< prev | top | contents | next >
References
- De Vries LS, Smet M, Goemans N et al. (1992) Unilateral thalamic haemorrhage in the pre-term and full-term newborn. Neuropediatrics 23, 153–156.
- De Vries LS, Eken P, Groenendaal F et al. (1998) Antenatal onset of haemorrhagic and/or ischaemic lesions in preterm infants: prevalence and associated obstetric variables. Arch Dis Child Fetal Neonatal Ed 78, F51–56.
- De Vries LS, Groenendaal F, van Haastert IC et al. (1999) Asymmetrical myelination of the posterior limb of the internal capsule in infants with periventricular haemorrhagic infarction: an early predictor of hemiplegia. Neuropediatrics 30, 314–319.
- Ehrenforth S, Klarmann D, Zabel B et al. (1998) Severe factor V deficiency presenting as subdural haematoma in the newborn. Eur J Pediatr 157, 1032.
- Felderhoff-Mueser U, Rutherford M, Squier W et al. (1999) Relation between magnetic resonance images and histopathological findings of the brain in extremely sick preterm infants. Am J Neuroradiol 20, 1349–1357.
- Goevart P (1993) Cranial Haemorrhage in the Term Newborn Infant. London, MacKeith Press.
- Goevart P, Moens K and Leroy J (1992) Vacuum extraction, bone injury and neonatal subgaleal bleeding. Eur J Paediatrics 151, 532–535.
- Greer FR (1995) Vitamin K deficiency and hemorrhage in infancy. Clin Perinatol 22, 759–777.
- Hayashi T, Hashimoto T, Fukada S et al. (1987) Neonatal subdural haematoma secondary to birth injury. Child Nerv Syst 3, 23–29.
- Jayawant S, Rawlinson A, Gibbon F et al. (1998) Subdural haemorrhages in infants: population based study. BMJ 317, 1558–1561.
- Kuharik MA and Edwards MK (1987) Cerebral venous distention associated with cardiac failure in infants. Am J Neuroradiol 8, 657–659.
- Mercuri E, Cowan F, Rutherford M et al. (1995) Ischaemic and haemorrhagic brain lesions in newborns with seizures and normal Apgar scores. Arch Dis Child Fetal Neonatal Ed 73, F67–74.
- Mercuri E, He J, Curati WL et al. (1997) Cerebellar infarction and atrophy in infants and children with a history of premature birth. Pediatr Radiol 27, 139–143.
- Merrill JD, Piecuch RE, Fell SC et al. (1998) A new pattern of cerebellar hemorrhages in preterm infants. Pediatrics 102, E62.
- Pape KE, Armstrong DL and Fitzhardinge PM (1976) Central nervous system pathology associated with mask ventilation in the very low birthweight infant: a new etiology for intracerebellar hemorrhages. Pediatrics 58, 473–483.
- Perrin RG, Rutka JT, Drake JM et al. (1997) Management and outcomes of posterior fossa subdural hematomas in neonates. Neurosurgery 40, 1190–1199.
- Pohl M, Zimmerhackl LB, Heinen F et al. (1998) Bilateral renal vein thrombosis and venous sinus thrombosis in a neonate with factor V mutation (FV Leiden). J Pediatr 132, 159–161.
- Rutty GN, Smith CM and Malia RG (1999) Late-form hemorrhagic disease of the newborn: a fatal case report with illustration of investigations that may assist in avoiding the mistaken diagnosis of child abuse. J Forensic Med Pathol 20, 48–51.
- Sherer DM, Anyaegbunam A and Onyeije C (1998) Antepartum fetal intracranial hemorrhage, predisposing factors and prenatal sonography: a review. Am J Perinatol 15, 431–441.
- Thorp JA, Poskin MF, McKenzie DR et al. (1997) Perinatal factors predicting severe intracranial hemorrhage. Am J Perinatol 14, 631–636.
- Williamson WD, Percy AK, Fishman MA et al. (1985) Cerebellar hemorrhage in the term neonate: developmental and neurologic outcome. Pediatr Neurol 1, 356–360.
- Zuerrer M, Martin E and Boltshauser E (1991) MR imaging of intracranial hemorrhage in neonates and infants at 2.35 Tesla. Neuroradiology 33, 223–229.