Magnetic resonance imaging
of the brain in preterm infants:
24 weeks’ gestation to term
Malcolm Battin and Mary A Rutherford
Chapter Contents
- Introduction
- Cortical folding
- Ventricular system and extracerebral space
- Germinal matrix
- White matter
- Myelination
- Basal ganglia and thalami
- The future
- Summary
- References
Introduction
Brain maturation involves a complex sequence of morphological, functional and organizational changes. Although these changes are complex they occur in a sequence that is both organized and predictable. Pathological studies have been important in documenting the process of brain maturation but imaging offers the added advantage of being able to study the live fetus or infant. Furthermore, repeated or serial imaging may be performed, thus permitting longitudinal assessment of maturity both in utero and ex utero.
Ultrasound is readily available in the neonatal nursery and has been used extensively to assess the preterm infant brain; however, recently interest in using MRI in this age group has increased. Magnetic resonance imaging (MRI) is a non-invasive multiplanar technique that provides detailed images. Qualitative and quantitative assessment of brain development including myelination can be performed and pathological processes including migration disorders and neonatal intracranial hemorrhage are well demonstrated. Sequential imaging provides the means to study not only normal development but also the response of the brain to injury.
Although MRI is a useful technique in the preterm infant, differences exist from adult imaging and these must be addressed in order to obtain optimal images. The immature brain has higher water content than the adult brain and this is associated with a marked increase in T1 and T2 values. Appropriate changes in the pulse sequences are required in order to produce optimum images. In our experience it has been possible to produce good-quality images using the same sequence parameters between 23weeks and term, although measurements of T2 values have been shown to gradually decrease over this period9 (Fig. 3.1). T1 and T2 shortening occurs more dramatically from term age over the first year of life in association with myelination19.
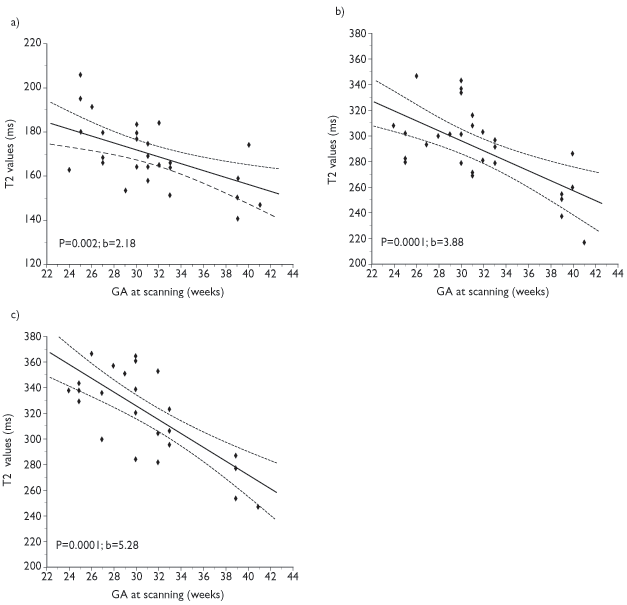
Fig. 3.1 T2 values at 1 Tesla in (a) the lentiform nuclei (b) the anterior white matter and (c) the posterior white matter at the level of the centrum semiovale. (Courtesy of Serena Counsell, Hammersmith Hospital.)
The aim of this chapter is to describe the MRI appearances of the brain in preterm infants imaged between 24 weeks’ gestational age (GA) and term (37–42 weeks). MR study of the developing brain is important, not only to illustrate the normal changes that occur but also because it may shed light on the origin of brain lesions causing long-term neurodevelopmental sequelae in the preterm infant. Evaluation of the developing brain using MRI is likely to be of value in the interpretation of isolated images taken later in infancy. MRI has also been shown to produce valuable postmortem data and it is feasible to image the neonatal brain both in and outside of the body after death.
In order to establish the normal variation in a preterm population we have attempted to image every infant born at less than 30 weeks’ gestation at the Hammersmith Hospital. The majority of images presented in this chapter were obtained from this cohort of over 150 preterm infants. Images were obtained using a 1T (Oxford Magnet Technology/Marconi Medical Systems) neonatal MRI system14 situated in the neonatal unit (see Chapter 2). The GA for the infants was calculated from the date of the last menstrual period and confirmed with data from early antenatal ultrasound scans. Parental consent for imaging the infants was obtained in each case and ethical approval for this study was given by the Hammersmith Hospitals Research Ethics Committee.
< prev | top | contents | next >
Cortical folding
The most obvious changes in the preterm brain between 24 weeks and term are the increase in overall size and the increase in cortical folding. Cortical development occurs from approximately 8 weeks, initially with replication of neurons and glial cells in the periventricular germinal zones. In the mammalian brain the germinal zone consists of a ventricular zone, which forms first, and a more superficial subventricular zone. The former produces mainly neuronal cells and the latter is responsible for mainly glial cell proliferation4 (see Fig. 3.14). Although these layers may be distinguishable histologically, they are indistinguishable on MRI. The ventricular zone is largely exhausted by the end of neuronal migration and residual ventricular zone cells become ependymal cells. The subventricular zone remains and persists into adult life as the subependymal layer. The term germinal matrix is usually used to describe the residual subependymal tissue in the caudothalamic notch, which is easily visible with cranial ultrasound. Using MR images it is possible to see that there is a densely cellular layer, the subependymal layer, lining the entire ventricle although it is most obvious overlying the caudate nucleus. It is not possible to differentiate the ependymal layer on MR images as this is only one cell thick.
The layers of the developing cortex are formed initially by neuronal migration along radial glia. Radial glia not only guide neurons but appear to facilitate the columnar organization of the cortex. The first wave of immature neurons to migrate form the preplate of the developing cortex, which is then split into an inner and outer layer by neurons arriving to form the cortical plate. The inner layer of the preplate is known as the subplate and plays an important role in cortical organization. The outer layer is the subpial marginal zone.
The permanent cortical layers form from the inside out, so that layer six which lies medially is laid down first. The mature cortex consists of six distinct layers in most areas of the brain. Neuronal migration to the cerebral cortex is completed by 20–24 weeks’ gestation in the human brain. Glial cell migration probably continues for at least 1 year post birth. Between 29 weeks’ gestation and term cortical gray matter volume increases from approximately 60ml to approximately 160ml17. This subsequent increase in cortical gray matter volume is secondary to glial cell migration, neuronal differentiation and organizational changes. Following migration, radial glia proliferate and differentiate into astrocytes and possibly oligodendrocytes within the white matter.
During early gestation the brain is smooth or ‘lissencephalic’ in appearance but as growth proceeds the typical convoluted pattern develops allowing a considerable increase in the surface area of the brain. Normal convolution probably relies on a full complement of neurons within the developing cortical plate. Primary sulci begin as a shallow groove with widely separated side walls and straight ends. The groove then becomes deeper and the side walls become progressively steeper approximating and eventually meeting each other. These secondary sulci may show V-shaped or bifid ends. With continued maturation, the gyri and sulci become complex and side branches develop as seen in the adult brain. Each of the gyri and matching sulci are named according to their site within the brain.
The anatomical development of the major sulci and gyri in the brain has been well documented by Chi et al.5 who studied 507 brains obtained from fetuses and infants from 10 to 44 weeks’ gestational age. The gyral development evolves in an ordered fashion up until term.
In pathological series, the first fissure to develop is the interhemispheric fissure, which appears at 8 weeks’ gestation. It starts anteriorly and proceeds posteriorly separating the two cerebral hemispheres by 10 weeks’ gestation. At 14 weeks the Sylvian fissure begins as a shallow depression formed by the progressive indentation of the cortex in the region of the insula. By 19 weeks the Sylvian fissure is deeper and the insula can be identified. At 20 weeks the central sulcus is first seen. The parieto-occipital fissure, which divides the parietal from the occipital lobe, is first seen at 16 weeks and is documented on antenatal ultrasound in all infants by 24 weeks’ gestation. The calcarine sulcus appears at about 16 weeks and joins the parieto-occipital fissure anteriorly. Together they form a Y shape that is easily visible on parasagittal ultrasound scan. The calcarine sulcus is seen on ultrasound in the majority of infants by 24–25 weeks and in all infants by 26–27 weeks. The cingulate sulcus is present in the anterior frontal lobe by 18 weeks’ gestation on ultrasound but may lag behind as in 25% of infants it is not visible until 24–25 weeks. The callosal sulcus separates the cingulate gyrus from the corpus callosum and appears at 14 weeks’ gestation but is not a constant finding on ultrasound until 24 weeks’ gestation. The process of cortical folding is also recognizable on postnatal ultrasound15, 27, 30and may be used as a guide to GA. Murphy et al.24 used ultrasound to study the development of sulci on the lateral and medial surfaces of the brain in preterm infants between 24 weeks and 34 weeks.
Using MRI Martin et al.22 described a four-stage grading system for the structural maturation of the brain surface. In stage 1 there is lissencephaly; in stage 2 the primary gyri are well identified and separated by shallow sulci; in stage 3 the infolding of the brain surface is more pronounced; and in stage 4 the adult pattern with well-developed tertiary gyri and sulci is seen. This system, however, is not detailed enough to be used for assessment of sulcation in a population of premature or extremely premature infants. Systematic study of sulcal and gyral development using MRI has been reported in infants from 30 weeks onwards by Van der Knapp et al.29 and subsequently in infants as immature as 25 weeks’ gestation3. The gyral development score is a scoring system used to describe cortical folding. A score of 1–5 is given for different areas of the brain depending on the depth, width, the relationship to adjacent sulci, and the complexity of sulcation and gyration. Using this scoring system an increase in cortical folding can be seen in each area which correlates well with increasing age (Fig. 3.2).
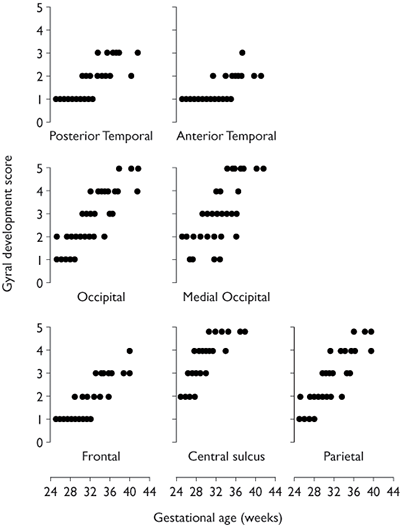
Fig. 3.2 Gyral development score versus gestational age for the posterior part of the temporal lobe, the anterior part of the temporal lobe, the occipital lobe minus the medial area, the medial occipital lobe, the frontal lobe minus the central sulcus, the central sulcus and the parietal lobe minus the central sulcus. The graphs demonstrate the different rates of cortical development in the different brain regions. (Reproduced from Battin et al.3 by permission of Pediatrics.)
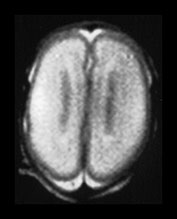

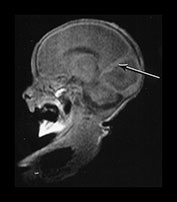
Fig. 3.3 Cortical folding at 25 weeks’ gestation. (a) T2 weighted fast spin echo sequence (FSE 3000/208) in the transverse plane. (i) At the level of the centrum semiovale, the brain surface is smooth. The central sulcus is not seen but at a lower level (ii) there is a widely open very rudimentary Sylvian fissure (arrow).
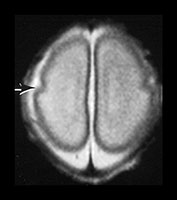
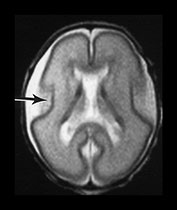
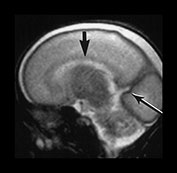
Fig. 3.4 Individual variation in cortical folding. T2 weighted fast spin echo sequence (FSE 3000/208) in transverse plane at 25 weeks’ gestation. (a) At a supraventricular level, in the transverse plane the brain surface is smooth but the central sulcus is visible, as a rudimentary shallow infolding of the cortex (arrow). (b) At a mid-ventricular level the Sylvian fissure is widely open (but less than in Fig. 3.3) and the insula cortex exposed (arrow). (c) The sagittal image shows early development of the calcarine fissure (long arrow). The corpus callosum can be seen as low signal intensity (short black arrow).
MRI can be performed as early as 23 weeks’ gestation and at this stage a rim of cortex is demonstrated as high signal intensity compared to the underlying white matter on T1 and low signal intensity on T2 weighted images. In our cohort of infants there was some variation in cortical maturity in infants born at the same gestation (Fig. 3.3 and Fig. 3.4). Delays in cortical folding may have important neurodevelopmental consequences or may just reflect normal individual variation.
Visual analysis of cortical folding is sufficient for identifying major abnormalities or discrepancies in maturation (Fig. 3.11). Occasionally, the evolution of abnormal folding can be detected with serial imaging in the very preterm infant (Fig. 3.12). Visual analysis of images of term-equivalent preterm infants is not sufficient to detect a milder delay or abnormality in cortical folding (Fig. 3.10).
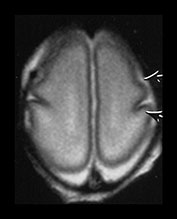

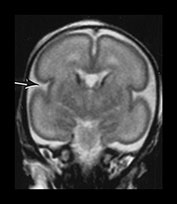
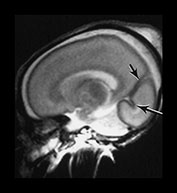
Fig. 3.5 Cortical folding at 26 weeks’ gestation. T2 weighted fast spin echo sequence (FSE 3000/208) in transverse, coronal and sagittal planes. (a) At a supraventricular level, the brain surface is smooth except for the central sulcus (bottom arrow) and rudimentary precentral sulcus (top arrow). (b) At a lower level the Sylvian fissure is still open with the insula still partly exposed (arrow). (c) This is well seen on the coronal images (arrow). (d) On sagittal images the the parieto-occipital fissure is well formed (short arrow) and the calcarine fissure is more obvious (long arrow).
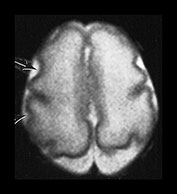
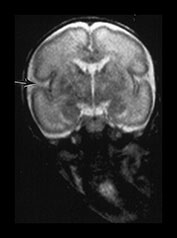
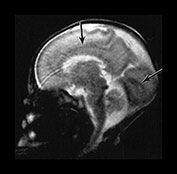
Fig. 3.6 Cortical folding at 28 weeks’ gestation. T2 weighted fast spin echo (FSE 3000/208) sequence in (a) transverse, (b), sagittal, and (c) coronal planes. (a) At a supraventricular level, in the transverse plane the central sulcus has developed further and is now deeper with more closely applied edges and a narrow opening. The precentral sulcus is also more developed but is still shallow and has a wide opening (long arrow). There are also signs of postcentral sulcus forming posteriorly to the central sulcus (arrowhead). (b) On the coronal image the Sylvian fissure is still open but is beginning to close (arrow). (c) On the sagittal image the calloso-marginal gyrus is just evident and the calcarine sulcus is well developed demonstrating a ‘long stem to the Y’ (right arrow). The cingulate sulcus is well demonstrated but not yet branched (top arrow).
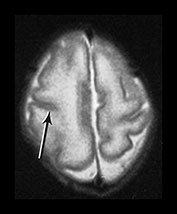
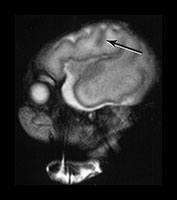
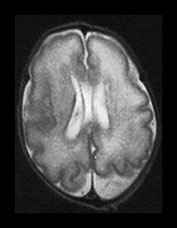
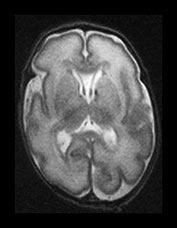
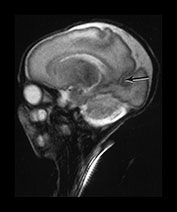

Fig. 3.7 Cortical folding at 30 weeks’ gestation. T2 weighted fast spin echo (FSE 3000/208) sequence in transverse and sagittal planes. These images are slightly rotated giving some asymmetry between the appearances demonstrated. (ai,ii) Both the pre- and postcentral sulci are obvious and the central sulcus is deep and narrow but unbranched in appearance (arrow). (b) At a lower level there are numerous shallow sulci forming in the parietal lobes. There is a normal wide posterior extracerebral space. (c) Closure of the Sylvian fissure is well advanced. This is also demonstrated on the sagittal image (aii). (d) On the sagittal image the parieto-occipital and calcarine sulcus are well developed (arrow). The corpus callosum is seen as low signal intensity. (e) By 30 weeks the cingulate sulcus has a slightly curvy appearance (arrow).


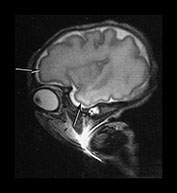
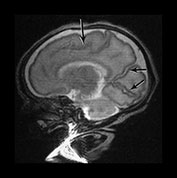
Fig. 3.8 Cortical folding at 32 weeks’ gestation. T2 weighted fast spin echo (FSE 3000/208) sequence in transverse, sagittal and coronal planes. (a) The central sulcus is becoming more complex (arrow). (bi,ii) The Sylvian fissure is almost closed (arrow). (c) The frontal and anterior temporal lobes remain relatively smooth (arrows). (d) The cingulate sulcus demonstrates secondary branches (arrow). The parieto-occipital and calcarine fissures continue to develop and are very well demonstrated (short arrows).

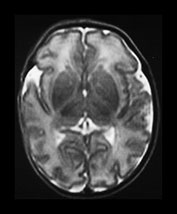
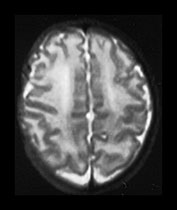

Fig. 3.9 34 weeks’ gestation. T2 weighted fast spin echo (FSE 3000/208) sequence in transverse plane (bi,ii) and T1 weighted spin echo (SE 600/20) sequence in sagittal plane (a, c). The sulci are complex. The Sylvian fissure is closed. (a, bi) The frontal lobes remain less folded. (bi) The cingulate sulcus is branched (short arrow). The calcarine is complex and branched (long arrow) (c).
COMPUTERIZED QUANTIFICATION OF CORTICAL FOLDING
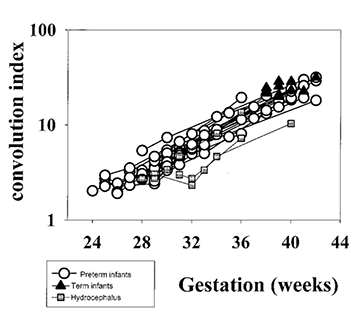
In order to study cortical development in more detail we have developed a computerized method for quantifying cortical folding25. We use T2 weighted fast spin echo images as these give optimum contrast between the cortex and underlying white matter. The process involves drawing a cortical contour as a template for each slice of the brain. The program then measures the length and curvature of this cortical contour. A curvature code is produced. The program also allows a measure of cortical density to be obtained and the product of this and the curvature code gives a cortical convolution index. Using this program we have shown an exponential increase in the whole cortical convolution index (measuring all slices through the brain but excluding the cerebellum) from 24 weeks until term (Fig. 3.13).
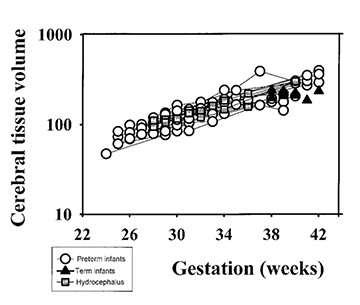
It has been suggested that gyral development proceeds in a programmed fashion and that there is little effect of illness on this pattern23. However, this has been questioned by Hüppi16. At term-equivalent age, preterm infants show less cortical folding than infants born at term (Fig. 3.13) 1 2 5 . This is not explained by a smaller brain size as the brain volumes between the two groups are not significantly different (Fig. 3.13). These findings imply that the brain of the preterm infant is developing in a different way ex utero. The differences in cortical development compared with those infants born at term may be associated with the increase in neurocognitive and neurobehavioral disorders seen in ex-preterm children7, 28.


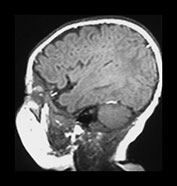
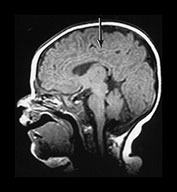

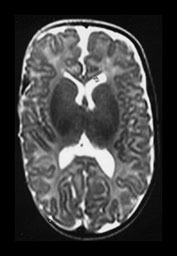
Fig. 3.10 Term gestation. Infant born at term. T2 weighted fast spin echo sequence (FSE 3000/208) in transverse plane. (ai,ii) Although the brain shows a pattern approaching that of an adult the numbers of gyri are less and sulci are not as deep as in the adult. The posterior corpus callosum is seen as low signal intensity (ii). (bi,ii) T1 weighted spin echo sequence (SE 600/20) in sagittal plane. The cingulate sulcus is easily visible the whole length of the brain on MRI (ii) (arrow). It has been described as having a cobblestone appearance on ultrasound. The corpus callosum is difficult to differentiate from the surrounding brain. (ci,ii) T2 weighted images (FSE 3000/208) sequence. Infant born at 27 weeks and imaged at term-equivalent age. Although the shape of the brain is highly suggestive that this infant was born preterm there is no obvious difference in the cortical folding. The shape also gives the impression on a single image that there is less white matter then the term-born infant.
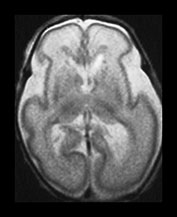
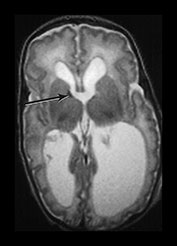
Fig. 3.11 Delayed cortical folding. T2 weighted images (FSE 3000/208). Infant born, one of twins, at 27 weeks’ gestation. (a) The initial image on day 2 shows appropriate cortical folding. (b) Infant imaged at term. The image is markedly abnormal. There is a small area of low signal intensity corresponding to a previous germinal matrix/subependymal hemorrhage (arrow). This infant developed severe ventricular dilation secondary to a large intraventricular hemorrhage. The cortical development is inappropriate for term with very shallow sulci. In infants with ventricular dilatation the cortex appears to unfold as a result of increased intraventricular pressure (Fig. 3.13).
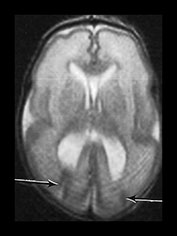

Fig. 3.12 Abnormal cortical folding. T2 weighted images (FSE 3000/208). sequence. Surviving twin born at 27 weeks’ gestation. (a) Imaged at 4 weeks of age. There are bilateral abnormal cortical folds posteriorly, the right-sided fold extending up to the ventricular wall (arrows). This image is slightly artifacted. (b) Imaged at 6 months of age (uncorrected). There has been generalized maturation of cortical folding but there are bilateral abnormal sulci in the posterior temporal lobes (arrows).
< prev | top | contents | next >
Ventricular system and extracerebral space
Very preterm infants <26 weeks’ gestation may have a transient mild dilation of the posterior horns of the lateral ventricles, a developmental colpocephaly (Fig. 3.16). The ventricles are smooth in outline but may show some asymmetry. In most cases the left ventricle is larger than the right. The reason for this asymmetry is unclear but has also been noted on fetal MRI12 and on ultrasound. On repeat scan at term-equivalent age the asymmetry may persist or no longer be apparent. In the very preterm infant there is a marked widening of the posterior parietal extracerebral space (Figs 3.5 – Fig. 3.8). This may persist until approximately 36 weeks; it is minimally widened in Fig. 3.9 at 34 weeks, but is only occasionally seen at term-equivalent age. The space has been termed benign external hydrocephalus13 but probably represents a normal development process. This posterior widening gradually disappears and is not usually apparent at term-equivalent age.
At term-equivalent age there may be an increase in the anterior extracerebral space with widening of the anterior interhemispheric fissure (Fig. 3.26) 20. This is often attributed to atrophy of the brain but it may not be secondary to a reduction in brain size (Fig. 3.13) and tends not to persist beyond 1 year of age.
 (a)
(a)
 (b)
(b)
 (c)
(c)
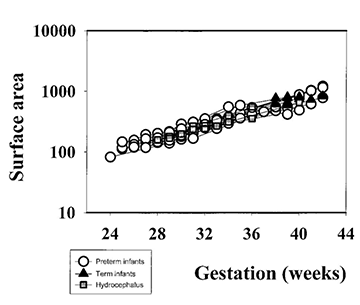
Fig. 3.13 Cortical development from 24 weeks’ gestation until term-equivalent age. (a) Cortical folding measured as a whole cortex convolution index (WCCI). (b) Cortical surface area. (c) Brain volume (without ventricles). (Courtesy of Dr Ajayi Obe, Hammersmith Hospital.)
< prev | top | contents | next >
Germinal matrix
The germinal matrix or subependymal layer is situated at the surface of the lateral ventricles. It consists of a loose stroma and is highly vascularized with irregular endothelial lined vessels. From 10 to 20 weeks’ gestation it is responsible for neuroblast and glioblast production and thereafter glioblast production alone, from the subventricular zone. The matrix includes the transient ventricular zone and the subventricular zone and increases in volume from 13 weeks’ gestation to a maximum at about 26 weeks’ gestation. It then regresses although it persists for longer in the caudothalamic notch and in the roof of the temporal horn. On cranial ultrasound the term ‘germinal matrix’ is usually applied to the tissue seen in the caudothalamic notch. On MRI the germinal matrix may be visualized as a prominent structure at the lateral margin of the lateral ventricles, overlying the caudate (Fig. 3.14) and at the roof of the temporal horns of the lateral ventricles. The subependymal layer also appears to extend as a much thinner layer all around the ventricles. It is characterized by a high signal intensity on T1 weighted images and more obviously as a low signal intensity on T2 weighted images (Fig. 3.14)20.
The germinal matrix can be identified by virtue of its shape and location adjacent to the lateral ventricles as well as its signal characteristics. This appearance of high signal on T1 weighted and low signal on T2 weighted images in the germinal matrix is also described on fetal imaging12 and persists until between 30 and 32 weeks’ gestation, continuing for longer on the T2 weighted images (Fig. 3.15).
Germinal matrix is easier to identify on MRI than on ultrasound. Using MRI it is possible to identify thicker rests of germinal tissue, over the caudate heads and at the roof of the temporal horn of the lateral ventricles. It is also possible to detect the thinner cellular layer that lines the entire ventricular system. On ultrasound the germinal matrix is only really identified over the caudate heads. This is partly because cranial ultrasound is not routinely used in the transverse plane and therefore matrix in the temporal horns cannot be detected. In addition, the subependymal layer elsewhere around the ventricles may to be too thin for detection by ultrasound.
Germinal matrix hemorrhage has similar characteristics to germinal matrix with a short T1 and T2 but is distinguished from normal matrix by its irregular shape, asymmetry and persistence of susceptibility effect (Fig. 3.16) (see Chapter 9). Preterm infants may show small lesions consistent with hemorrhage within the subependymal layer with or without evidence of hemorrhage in more classical sites of matrix over the caudate nuclei (Fig. 3.17). In addition, infants with multiple hemorrhagic lesions may appear to have white matter lesions but in fact the lesions are in the subependymal layer and partial volume effects give the appearance of white matter lesions, particularly superiorly (Fig. 3.17).

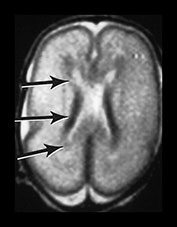

Fig. 3.14 Germinal matrix/subependymal layer at 25 weeks. (a) T2 weighted fast spin echo sequence (FSE 3000/208) at (i) a supraventricular level, and (ii) a high ventricular level. The germinal matrix is seen as low signal intensity and lines most of the lateral ventricular wall overlying the caudate nucleus (middle arrow). A thinner band of low signal intensity seen around the remaining areas of ventricle consistent with densely cellular area of subependymal tissue (top and bottom arrows) (a ii), which is responsible for glial cell migration. (b) T1 weighted sequence (SE 600/20) in the transverse plane, high ventricular level. The germinal matrix is seen as high signal intensity on T1 weighted images (arrow). The subependymal layer elsewhere is seen as a thinner band of high signal intensity (short arrow).
< prev | top | contents | next >
White matter
The high water content of the premature infant brain produces relatively long T1 and T2 times and gives rise to a low signal on T1 weighted images in the white matter. As previously mentioned, provisional data suggest that these values gradually decrease between 24 weeks and term. Term-born infants demonstrate a steady decrease in the brain water content throughout the first 2 years of life.
Within the white matter of the centrum semiovale (CSO) and periventricular area, several well-defined layers of alternating signal intensity are observed in the brain of preterm infants. At 24 and 25 weeks’ gestation four layers can be identified in the CSO. These represent the cortex, subcortical white matter, an intermediate zone representing migrating cells and a periventricular zone representing developing white matter. This periventricular zone lies adjacent to the subependymal layer or germinal matrix (Fig. 3.18).
At a low ventricular level the bands are incomplete but areas are observed around the anterior horns of the lateral ventricles that form the shape of a ‘cap’ (Figs. 3.19 and 3.23) and around the posterior horns of the lateral ventricles forming the shape of an ‘arrowhead’. These ‘caps’ and ‘arrowheads’ are in continuity with the multilayered periventricular appearance described above. Caps have an additional area of low signal intensity on T2 weighted images (high signal intensity on T1 weighted images) (Figs. 3.19 and 3.23).
Arrowheads differ from the caps by their posterior site and characteristic shape. They also do not have alternating layers of long and short T2 within them. Infants born at ≤27 weeks’ gestation may not demonstrate high signal intensity within bands, caps and arrowheads when first imaged but this develops on follow-up imaging with increasing GA20. Histologically, these sites correspond to regions with dense white matter fibers converging from different regions of the brain.
In posterior white matter it is possible to see the developing optic radiation with a cellular layer either side (Fig. 3.19). In summary, layers of high and low signal intensity are found within the unmyelinated white matter of the CSO and periventricular regions. These may be described as ‘bands’ in the CSO and periventricular white matter, ‘caps’ around the anterior horns of the lateral ventricles and ‘arrowheads’ around the posterior horns of the lateral ventricles.
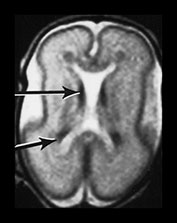
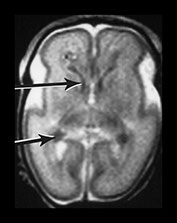
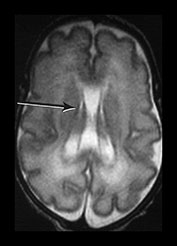

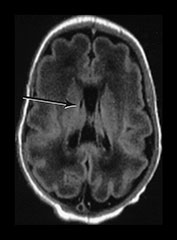
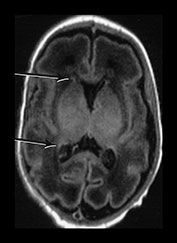
Fig. 3.15 Involution of the germinal matrix. T2 weighted fast spin echo (FSE 3000/208) and T1 weighted spin echo sequence (TE 600/20). (a) Mid-ventricular level (i) and low ventricular level (ii). At 25 weeks’ gestation germinal matrix is visible as low signal intensity in the anterior horns continuing posteriorly over the caudate heads (long arrow). It is also seen in the roof of the temporal horns (short arrow). (b) T2 weighted fast spin echo sequence (FSE 3000/208) (i,ii) and T1 weighted spin echo sequence (SE 600/20) (iii,iv). At 31 weeks the germinal matrix has involuted and is barely visible on T1 weighted images (arrows) but is more obvious on the T2 weighted images (bi) (arrow) (bii) (top and middle arrows). There is a persistent low signal lining the ventricles (bii) (bottom arrow) consistent with the densely cellular subependymal layer.
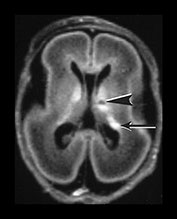

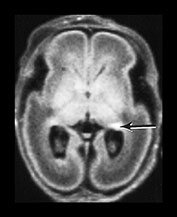
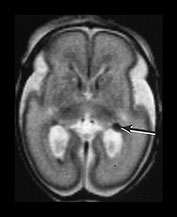

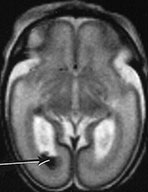
Fig. 3.16 Germinal matrix hemorrhage. Preterm infant born at 25 weeks imaged at 2 days. (i) T1 weighted spin echo sequence (SE 600/20), and (ii) T2 weighted fast spin echo (FSE 3000/208) sequence. Imaged at a mid-ventricular level (a), low ventricular level (b), and through the occipital horns (c). Subependymal germinal matrix hemorrhage is seen as areas of asymmetrical irregular signal intensity within the germinal matrix, high on T1 weighted images and low on the T2 weighted images (short arrows). There is a small cystic lesion on the left (arrowhead). There is additional hemorrhage within the ventricles (long arrows). The ventricles are slightly dilated at this level although this may just be secondary to the normal colpocephaly at this gestation.
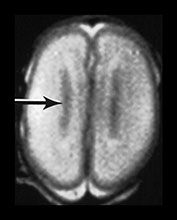
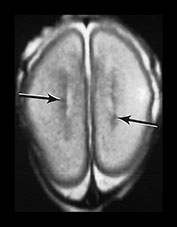

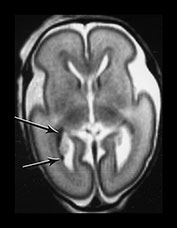
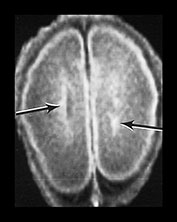
Fig. 3.17 Subependymal layer. T2 weighted fast spin echo sequence (FSE 3000/208) at 25 weeks’ gestation. (a) Normal appearances. There is an area of low signal intensity (arrow) centrally consistent with the densely cellular subependymal layer adjacent to the roof of the lateral ventricles. (bi,ii,iii) Hemorrhagic lesions. There are multiple areas of low signal intensity consistent with hemorrhage in the germinal matrix (long arrow) and possibly in other subependymal areas (short arrow). (c) T1 weighted spin echo sequence (SE 600/20). These hemorrhagic lesions are seen as high signal intensity (arrows).
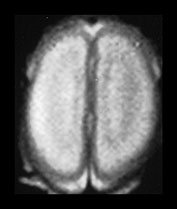

Fig. 3.18 White matter appearances at 25 weeks’ gestation. (a) T2 weighted fast spin echo sequence (FSE 3000/208) and (b) T1 weighted spin echo sequence (SE 600/20) in the transverse plane through the centrum semiovale. Four distinct layers are seen at this level at this gestation. (a) The cortex (low SI), the subcortical white matter (high SI) an intermediate band (low SI) and a central periventricular band (high SI). (b) The cortex (high SI), the subcortical white matter (low SI) an intermediate band (high SI) and a central periventricular band (low SI). The germinal matrix or subependymal layer is not seen at this level. Histological comparisons have shown that the MR appearances of these white matter bands relate to the relative density of cells within them10. The intermediate band is densely cellular consisting of cells that are migrating outwards to the cortex. This corresponds to the known migration of glial cells at this gestation. Neuronal migration is thought to be complete by 20 weeks’ gestation. These migrating glial cells have also been demonstrated histologically10. The periventricular layer is fiber rich and represents developing white matter.
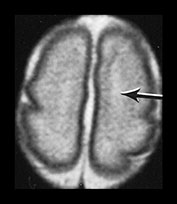

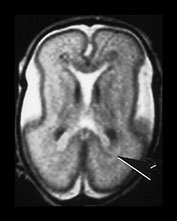

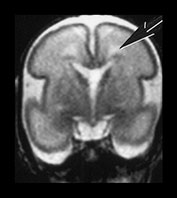
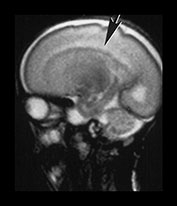
Fig. 3.19 White matter appearance at 27 weeks’ gestation. T2 weighted fast spin echo sequence (FSE 3000/208). (a) Transverse images at level of (i) centrum semiovale, (ii) high ventricular level, (iii) mid-ventricular level, (iv) low ventricular level; (b) coronal plane through the basal ganglia; (c) parasagittal plane. The developing white matter is seen as a high signal intensity region (arrows) adjacent to the low signal intensity germinal or subependymal layer. This takes the form of arrowheads posteriorly (arrowhead) (a iii) and caps anteriorly (arrowhead) (a iv). The more lateral adjacent low signal intensity representing a layer of migrating cells is less obvious. The developing optic radiation can be seen as a thin layer of high signal intensity between the subependymal layer and the lateral layer of migrating cells (arrow) (a iv).


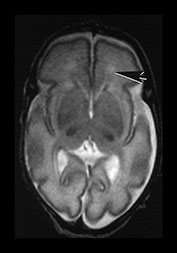

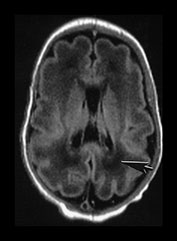

Fig. 3.20 White matter appearances at 32 weeks’ gestation. (a) T2 weighted fast spin echo (FSE 3000/208) and (b) T1 weighted spin echo (SE 600/20) sequence. Transverse plane at high (i) mid (ii) and low (iii) ventricular level. The periventricular layer of developing white matter is wider and more obvious than at 27 weeks’ gestation (arrows) (ai, bi). It is clearly seen anteriorly forming part of the ‘cap’ (arrowhead) (aiii, biii) and posteriorly to from the ‘arrowheads’ (arrowhead) (aii, bii).
The MRI appearances described are thought to be part of the normal developmental features of the white matter since, as we have seen them on first MRI in over 95% of infants born at less than 30 weeks’ gestation respectively3. The periventricular bands were also demonstrated in another imaging study of preterm infants6. In Maalouf et al’s study loss of bands, caps or arrowheads was associated with cerebral pathology such as large hemorrhagic infarction and posthemorrhagic hydrocephalus20. The bands, caps and arrowhead appearances do become less obvious with increasing GA. Child et al.6 have described multiple bands consistent with ‘waves’ of migrating cells in the white matter. Whilst we see distinct layers of altering signal intensity within the cerebral hemispheres we have not identified multiple bands of short T1, short T2 consistent with different bands or waves of cells with MRI or on histology. This may be due to inadequate image definition but it is possible that the effect of multiple bands of cells may sometimes be produced by either motion artifact and or partial volume effects.

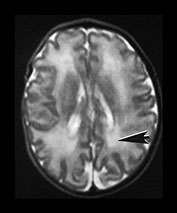

Fig. 3.21 White matter appearances at 34 weeks’ gestation. T2 weighted fast spin echo (FSE 3000/208) sequence in the transverse plane through (i) the centrum semiovale (ii) mid and (iii) low ventricular level. The periventricular high signal intensity is less discrete although it can still be distinguished as a layer (arrow) (i) with posterior arrowheads (arrowhead) (ii) and anterior caps (arrowhead) (iii).
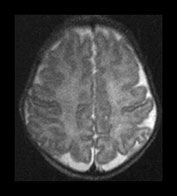
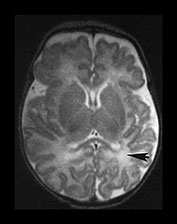
Fig. 3.22 White matter appearances at term-equivalent age. T2 weighted fast spin echo sequence (FSE 3000/208) (i) level of the centrum semiovale. There is no periventricular layer of high signal intensity and (ii) low ventricular level. There is only minimal high signal intensity in the region of the posterior (arrowhead) and anterior periventricular white matter.
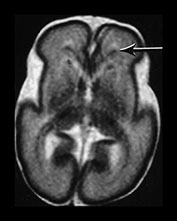

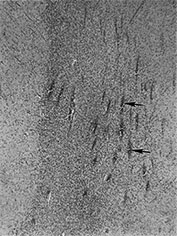

Fig. 3.23 Anterior caps at 27 weeks’ gestation. (a) T2 weighted fast spin echo (FSE 3000/208). The anterior cap is seen as a medial low and peripheral high signal intensity (arrow) and (b) T1 weighted spin echo (600/20) sequence. The anterior cap has a medial high and a peripheral low signal intensity (arrow). (c) Histological appearances at (i) ¥ 50 magnification. There is a dense band of cells, which appear to be migrating out from the germinal matrix or subependymal layer in the anterior horn (arrows). The medial part of the cap corresponds to this relatively cell-rich area. (ii) ¥ 250 magnification. The migration is clustered in lines or ‘fountains’ along small blood vessels (short arrows). (Courtesy of Dr W Squier, The Radcliffe Infirmary, Oxford.)
We have noted that in some infants approaching term the white matter demonstrates a long T1, long T2 component, the so-called diffuse excessive high signal intensity (DEHSI) on T2 weighted images20 (Fig. 3.24). This is probably normal if restricted to the arrowheads and caps but in some infants is more diffuse and extends beyond these areas towards the subcortical white matter. Preliminary studies have shown that DEHSI is associated with the development of abnormal long T2, consistent with glial tissue, in the periventricular white matter at 2 years of age (Fig. 3.25). These later changes could be described as a mild form of periventricular leukomalacia but whilst they may be associated with ventricular dilation the ventricular outline is usually normal. The corpus callosum may be thin. These periventricular and corpus callosal changes are a common finding when ex-preterm children and adolescents are imaged7 but the exact relationship to later neurodevelopmental and neurocognitive deficits remains unclear. It is possible that these relatively focal changes are the visible side of a process that may have effected a much larger amount of developing brain, so-called perinatal teloleukoencephalopathy21.
In some ex-preterm infants there is ventricular dilation and widening of the extracerebral space at term, findings that suggest cerebral atrophy20. However, these findings may not be apparent at later follow-up imaging although children born preterm have smaller heads than term-born controls7. Serial measurements of brain and ventricular volume may help clarify this relationship, although in our initial studies there is no difference between the brain volume of ex-preterm infants at term-equivalent age and term-born controls (Fig. 3.13).

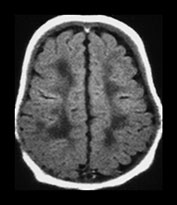
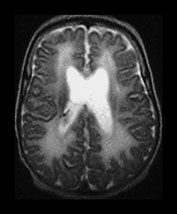


Fig. 3.24 Diffuse excessive high signal intensity. Preterm infant born at 27 weeks’ gestation and imaged at term-equivalent age. (a) T2 weighted fast spin echo sequence (FSE 3000/208) and (b) T1 weighted spin echo sequence (SE 600/20) at the level of the (i) centrum semiovale, (ii) high ventricular and (iii) low ventricular level. The white matter has areas of excessive high signal intensity on the T2 weighted images and excessive low signal intensity on T1 weighted images. This infant subsequently died. No postmortem was performed.
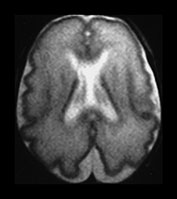

Fig. 3.25 Periventricular white matter abnormalities. (a) Neonatal imaging. T2 weighted fast spin echo sequence (FSE 3000/208). At 27 weeks’ gestation the posterior periventricular white matter is unremarkable but it is not possible to see the normal arrowhead on the right. (b) Follow-up imaging at 2 years of age. Conventional T2 weighted sequence (SE 2700/120). There is some widening of the extracerebral space and moderate dilatation of the ventricles. There is excessive increased signal intensity in the posterior periventricular white matter. It is more marked on the right (arrow). This is more dense and more extensive than is seen in normal control infants at this age.

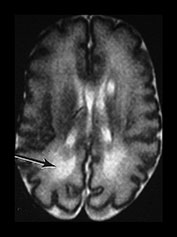
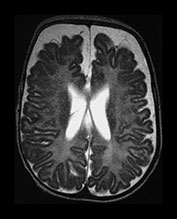
Fig. 3.26 Sequential imaging of the white matter in a 26 weeks’ gestation infant. T2 weighted fast spin echo sequence (FSE 3000/208) (a) at 29 weeks; (b) at 32 weeks; (c) and at 6 months uncorrected. There is some high signal intensity within the white matter. This may be slightly excessive in the region of the posterior horns (arrow) at 32 weeks but is normal anteriorly (b). At term this infant has markedly widened extracerebral space and anterior interhemispheric fissure. The ventricles were also dilated. The relationship between signal intensity changes in the white matter, ventricular dilatation and widening of the extracerebral space remains unclear.
< prev | top | contents | next >
Myelination
Myelination of white matter enables the more effective transmission of neural impulses. It can be demonstrated histologically to occur in a systematic fashion beginning with the medial longitudinal fasciculus at the end of the first trimester. It is, however, predominantly a post-term process and continues at least until the end of the second year. On MRI, myelination is associated with a shortening of T1 and T2 and is seen as high signal intensity on T1 weighted sequences and low signal intensity on T2 weighted sequences. In term-born infants, early changes of myelination are best seen on T1 weighted images, particularly on inversion recovery images, in the first 6 months of life and thereafter on T2 weighted images26. However, in our experience of imaging preterm infants, evidence of myelination is observed more easily on fast T2 weighted spin echo rather than on T1 weighted scans perhaps due to the better contrast achieved with this sequence. Myelination appears in the inferior cerebellar peduncles as early as 25 weeks and is followed by the inferior colliculi, posterior brain stem and ventro-lateral nuclei of thalamus. In our cohort we have demonstrated myelin in all these areas in infants using a fast spin echo T2 weighted sequence on first scan (Fig. 3.27).


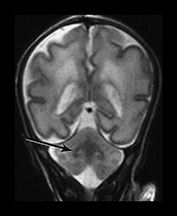
Fig. 3.27 Myelination. Infant imaged at 31 weeks’ gestation. T2 weighted fast spin echo sequence (FSE 3000/208). (a) Transverse plane (i) low-ventricular level. Low signal intensity corresponding to myelination with the region of the ventro-lateral thalamic nuclei is seen (arrow). (ii) Level of the mesencephalon. Low signal intensity corresponding to myelination within the inferior colliculi and the lateral lemnisci (arrow). (b) Coronal plane. (i) Low signal intensity consistent with myelin in the colliculi (arrow). (ii) There is low signal intensity within the dentate nuclei of the cerebellum (arrow).
Between 28 and 35 weeks we have found no evidence for new myelination on MRI8, 17. Chi et al.5 also report that there is relatively little new myelination between 29 and 40 weeks’ gestation and this is also our experience8. Using MRI myelination becomes evident in the posterior limb of internal capsule (PLIC) and in the corona radiata by 35 weeks. Histological studies demonstrate the onset of myelination in the PLIC to occur between 32 and 36 weeks’ gestation. The preterm infant appears to show myelination within the internal capsule at an earlier post-menstrual age than more mature infants (Fig. 3.28).
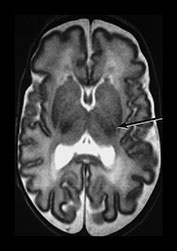

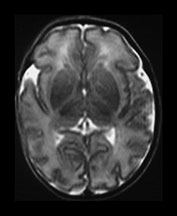
Fig. 3.28 Myelination in the posterior limb of the internal capsule. (a) T2 weighted fast spin echo sequence (FSE 3000/208) and (b) T1 weighted spin echo (SE 600/20). Preterm infant born at 30 weeks and imaged at 35 weeks. There is obvious myelin within the posterior limb of the internal capsule (arrow). This is not usually evident until 37 weeks in infants born at a later gestation. (c) T2 weighted fast spin echo sequence (FSE 3000/208). Infant born at 34 weeks and imaged at 35 weeks. There is no evidence of myelin within the posterior limb of the internal capsule.
The myelin sheath has a high lipid content, which is arranged in alternating layers with protein. The T1 shortening that is observed with the process of myelination probably occurs due to the hydrophilic cholesterol and glycolipid components of the developing myelin sheath26. T2 shortening is reported to occur at the time of tightening of myelin around the axon2 and may correlate best with the development of myelination determined on histological methods.
Myelination is usually only visible in the corpus callosum from 3 months of age. It is difficult to visualize the unmyelinated corpus callosum in the transverse plane in term infants prior to myelination (Fig. 3.10). However, the corpus callosum is clearly visualized on heavily T2 weighted imaging as low signal intensity, prior to myelination (Figs 3.4, 3.6 and 3.10) The reasons for this are unclear, but it may be secondary to tightly packed fibers reducing the water content of the structure and thereby decreasing its T2.
< prev | top | contents | next >
Basal ganglia and thalami
The basal ganglia and thalami in very preterm infants are characterized by a short T1 and are uniformly high signal intensity on T1 weighted images. On T2 weighted images the thalami are diffusely low signal intensity but the lentiform nucleus may have a more heterogeneous appearance. The ventro-lateral nuclei of the thalamus is clearly identifiable at 25 weeks’ gestation showing as a low signal area on T2 weighted images. This appearance is likely to be due to the increased cellular density of the nuclei and the presence of myelin which can be demonstrated histologically at this age. It is less obviously high signal intensity on T1 weighted images (Fig. 3.29). From 24 weeks until term the basal ganglia and thalami become more isointense on both T1 and T2 weighted images. By 35 weeks’ gestation there is only focal high signal intensity on T1 weighted images within the ventro-lateral nuclei and secondary to early myelination in the posterior part of the posterior limb of the internal capsule. There is additional more diffuse residual high signal intensity in the globus and posterior part of the putamen, inferiorly (see Chapters 4 and 6). On T2 weighted images there is low signal intensity in the ventro-lateral nuclei, which are very clearly seen. There is additional low signal intensity along the lateral border of the lentiform nuclei and in the posterior part of the posterior limb of the internal capsule (Fig. 3.29).
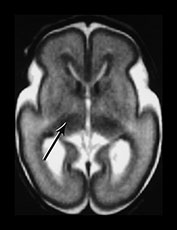

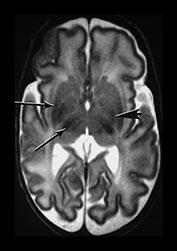
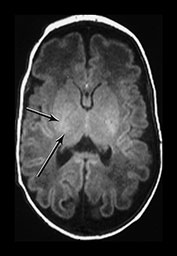
Fig. 3.29 Evolution of the appearances of the basal ganglia and thalami at 25 weeks’ gestation. (a) T2 weighted fast spin echo sequence (FSE 3000/208). There is diffuse slightly low signal in the thalami with a focal area or lower signal intensity laterally corresponding to the ventro-lateral nuclei (arrow). The lentiform nucleus is rather heterogeneous. (b) T1 weighted spin echo (SE 600/20). There is diffuse high signal throughout the lentiform nucleus and thalami. It is not possible to see myelin within the ventro-lateral nuclei. The posterior limb is very clearly seen as low signal intensity (arrow). 35 weeks’ gestation (c) T2 weighted fast spin echo sequence (FSE 3000/208). There is very obvious low signal intensity in the ventro-lateral nuclei of the thalami (bottom arrow). There is some low signal intensity along the lateral edge of the lentiform nucleus (top arrow). On this image there is some low signal intensity along the lateral border of the globus pallidum (arrowhead) (d) T1 weighted spin echo (SE 600/20). There is less high signal within the lentiform nuclei and thalami. There is a small, slightly indistinct, high signal intensity in the posterior part of the posterior limb of the internal capsule (short arrow). The rest of the limb still has a slightly low signal intensity. There is diffuse area of high signal intensity in the region of the ventrolateral nucleus (long arrow). This is not seen as clearly as on the T2 weighted imaging. The appearances are asymmetrical on this image. Assessment of any structure should always include the images above and below to avoid asymmetry from rotation being attributed to pathology.
< prev | top | contents | next >
The future
MRI is still a relatively new technique for imaging the very preterm infant. Any new developments in imaging the preterm infant have to be safe and quick as time is of the essence. Fast diffusion weighted imaging may increase our understanding on the formation of white matter tracts in health and disease18. Quantification of the brain and its structures will allow us to accurately compare the development of the brain with the development of the child17. This may produce more accurate neuroimaging correlates for later neurocognitive disorders. Spectroscopy is providing new insights into metabolic processes in response to injury (Chapter 16). Functional imaging is limited in the newborn but may also throw light on the mechanisms involved in normal and abnormal neurological functioning (Chapter 18). The interpretation of images is greatly aided by accurate histological comparisons although it is becoming increasingly difficult to obtain consent for postmortem with retention of the brain.
Summary
- Cell-rich regions such as the cortex and subependymal layer or germinal matrix have a short T1 and short T2.
- Sulcation and gyration of the cortex increases in a predictable way.
- Cortical folding can be quantified and appears to be reduced in preterm infants at term-equivalent age.
- MRI can detect bands of migrating glial cells.
- Germinal matrix involution can be documented.
- White matter structures of caps and bands and arrowheads correspond to normal developmental processes within the white matter of the immature brain.
- Diffusion weighted imaging and magnetic resonance spectroscopy should help to further characterize the developing white and gray matter.
< prev | top | contents | next >
References
- Ajayi-Obe M, Saeed N, Cowan FM et al. (2000) Reduced development of cerebral cortex in extremely preterm infants. Lancet 356, 1162–1163.
- Barkovich AJ, Gressens P and Evrard P (1992) Formation, maturation and disorders of the brain neocortex. Am J Radiol 13, 447–461.
- Battin MR, Maalouf EF, Counsell SJ et al. (1998) Magnetic resonance imaging of the brain in preterm infants: visualization of the germinal matrix, early myelination and cortical folding. Pediatrics 101, 957–962.
- Blakemore C (1995) Introduction: mysteries in the making of the cerebral cortex. In: Development of the Cerebral Cortex. Ciba Foundation Symposium 193, London, Wiley.
- Chi Je G, Dooling EC and Gilles FH (1977) Gyral development of the human brain. Ann Neurol 1, 86–93.
- Childs AM, Ramenghi LA, Evans DJ et al. (1998) MR features of developing periventricular white matter in preterm infants: evidence of glial cell migration. Am J Neuroradiol 19, 971–976.
- Cooke RW and Abernethy LJ (1999) Cranial magnetic resonance imaging and school performance in very low birth weight infants in adolescence. Arch Dis Child Fetal Neonatal Ed 81, F116–121.
- Counsell SJ, Maalouf EF, Rutherford MA et al. (1998) Assessment of myelination in white matter and central grey matter structures in the preterm using a novel neonatal MRI scanner. ISMRM, Abstract 91.
- Counsell SJ, Kennea NL, Herlihy AHet al. (2001) T2 relaxation values in the developing preterm brain. ISMRM, Abstract 410.
- Feess-Higgins A and Larroche JC (1987) Development of the Human Fetal Brain. Paris, INSERM.
- Felderhoff-Mueser U, Rutherford M, Squier W et al. (1999) Relation between magnetic resonance images and histopathological findings of the brain in extremely sick preterm infants. Am J Neuroradiol 20, 1349–1357.
- Girard N, Raybaud C and Poncet M (1995) In vivo MR study of brain maturation in normal fetuses. Am J Neuroradiol 16, 407–413.
- Girard N and Raybaud C (2000) Can benign external hydrocephalus be recognised in utero? Child Nervous System 16, 70.
- Hall AS, Young IR, Davies FJ et al. (1997) A dedicated magnetic resonance system in a neonatal intensive therapy unit. In: Bradley, WG and Bydder GM (Eds) Advanced MR Imaging Techniques. London, Martin Dunitz, pp. 281–289.
- Huang C-C (1991) Sonographic cerebral sulcal development in premature newborns. Brain Dev 13, 27–31.
- Hüppi PS, Schuknecht B, Boesch C et al. (1996) Structural and neurobehavioral delay in postnatal brain development of preterm infants. Pediatr Res 39, 895–901.
- Hüppi PS, Warfield S, Kikinis R et al. (1998a) Quantitative magnetic resonance imaging of brain development in premature and mature newborns. Ann Neurol 43, 224–235.
- Hüppi PS, Maier SE, Peled S et al. (1998b) Microstructural development of human newborn cerebral white matter assessed in vivo by diffusion tensor magnetic resonance imaging. Pediatr Res 44, 584–590.
- Johnson MA, Pennock JM, Bydder GM et al. (1983) Clinical NMR imaging of the brain in children: normal and neurologic disease. Am J Neuroradiol 4, 1013–1026.
- Maalouf E, Duggan P, Rutherford M et al. (1999) Magnetic resonance imaging of the brain in a cohort of extremely preterm infants. J Pediatr 135, 351–357.
- Leviton A and Gilles F (1996) Ventriculomegaly, delayed myelination, white matter hypoplasia, and ‘periventricular’ leukomalacia: how are they related? Pediatr Neurol 15, 127–136.
- Martin E, Kikinis R, Zuerrer M et al. (1988) Developmental stages of human brain: an MR study. J Comput Assist Tomogr 12, 917–922.
- McArdle CB, Richardson CJ, Nicholas DA et al. (1987) Developmental features of the neonatal brain: MR imaging. Part1. Gray–white matter differentiation and myelination. Pediatr Radiology 162, 223–229.
- Murphy NP, Rennie J and Cooke RWI (1989) Cranial ultrasound assessment of gestational age in low birthweight infants. Arch Dis Child 64, 569–572.
- Saeed N, Ajayi-Obe M, Counsell S et al. (1998) Convolution index computation of the cortex using image segmentation and contour following. ISMRM, Abstract 2076.
- Sie LTL, van der Knapp MS, van Wezel-Meijler et al. (1997) MRI assessment of myelination of motor and sensory pathways in the brain of preterm and term-born infants. Neuropediatrics 28, 97–105.
- Slagle TA, Oliphant M and Gross SJ (1989) Cingulate sulcus development in preterm infants. Pediatr Res 26, 598–602.
- Stewart AL, Rifkin L, Amess PN et al. (1999) Brain structure and neurocognitive and behavioural function in adolescents who were born very preterm. Lancet 353, 1653–1657.
- Van der Knaap MS, Wezel-Meijler G, Barth PG et al. (1996) Normal gyration and sulcation in preterm and term neonates: appearance on MR images. Radiology 200, 389–396.
- Worthen NJ, Gilbertson V and Lau C (1986) Cortical sulcal development seen on sonography: relationship to gestational parameters. J Ultrasound Med 5, 153–156.